
Power BI recently able users to embedded the R graphs in Power BI. There are some R visuals that it would be very nice to have them in Power BI.
What is R ? Based on Wikipedia, R is an open source programming language and software environment for statistical computing and graphics that is supported by the R Foundation for Statistical Computing. The R language is widely used among statisticians and data miners for developing statistical software and data analysis. Polls, surveys of data miners, and studies of scholarly literature databases show that R’s popularity has increased substantially in recent years.
R consists of different packages to perform tasks, now it has 1000 packages. there is a main package for draw visuals named “ggplot2”. This package consists of various functions to draw different types of charts.
How to start?
first download one version of the R in your machine, I have download “Microsoft R open” in my machine from here.
then open power bi desktop or download it from here
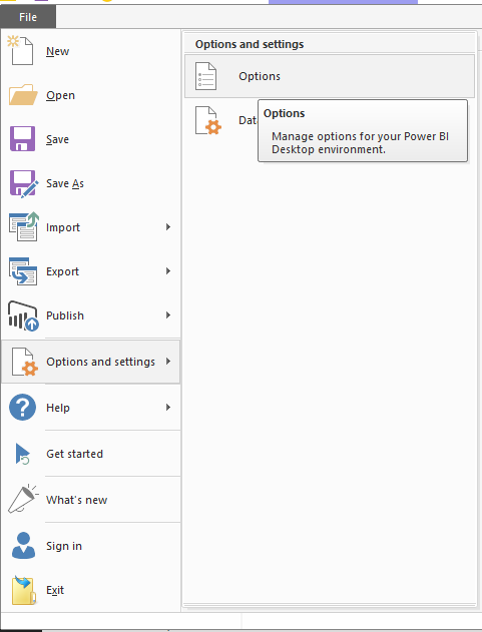
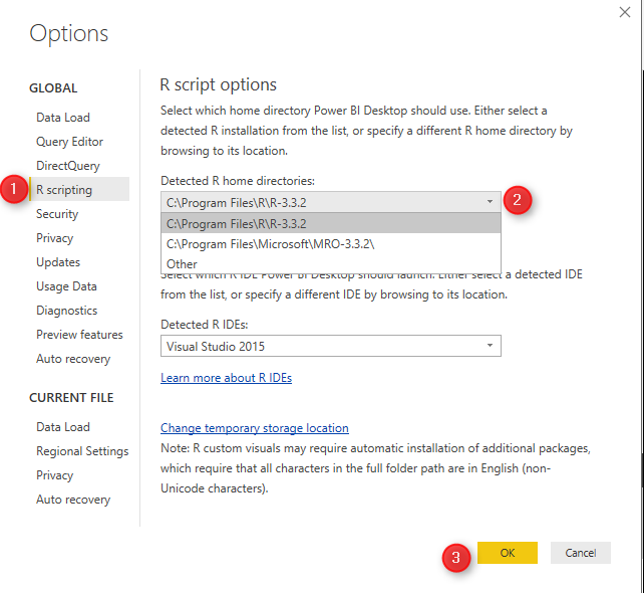
in power bi click on the File menue, then click on the “Options and Settings” then on ” Options”. under the “Global” option click n the “R Scripting” specify the R version.
There is a need to install the packages you need to work first in R version that you used first. in this example I am going to use “ggplot2” in power bi so first I have to open Microsoft R open and type
install.packages("ggplot2")
ggplot2 will install some other packages itself.
now I can start with power BI.
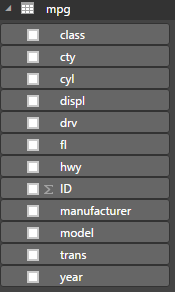
In power BI I have a dataset, that show specifications of cars such as : speed in city and highway, cylinder and so forth. if you interested to download this dataset, it is free name “mpg” from here.
then just click on the R visual in Power BI “R” visual and put in the white space as below.
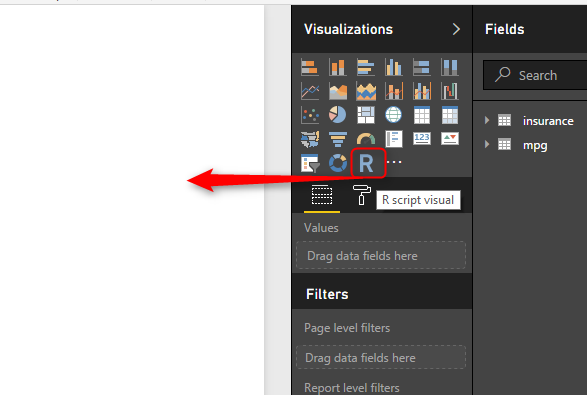
After bringing R visual in the report area. and by selecting “cty” (speed in city), “hwy” (speed in highway), and “cyl” (cylinder”). then in the “R script editor” you will see R codes there!
“#” is a symbol for comments in R language which you can see in R scripts Editor. Power BI automatically puts the selected fields in a variable name “dataset” so all fields (cty,hwy, and cyl) will store in a dataset variable by “<-” sign. also it automatically remove the duplicated rows. all of these has been explain in R script editor area.

next we are going to put our R code for drawing a two dimensional graph in power BI. In power BI, to use any R scripts, after installing in R version that we have, we have to call the packages using “library” as below
library(ggplot2)
so always, what ever library you use in power bi call it by library function first. there are some cases that you have to install some other packages to make them work, based on my experience and I think this part is a bit challenging!.
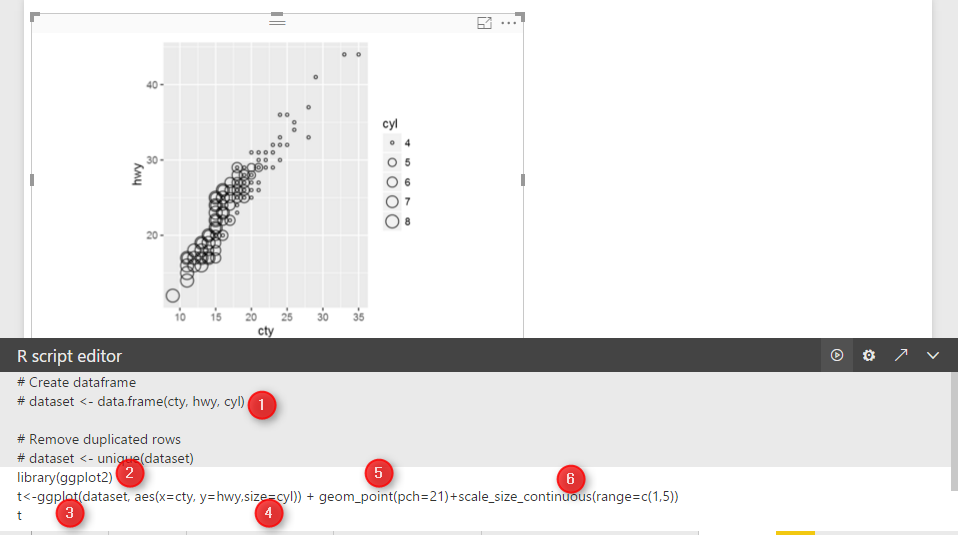
to draw a chart I first use “ggplot” function to draw a two dimensional chart. the first argument is “dataset” which holds our three fields. then we have another function inside the ggplot, named “aes” that identify which filed should be in x axis or in y axis. finally I also interested to shows the car cylinder in chart. This can be done by adding another layer in aes function as “Size”. so bigger cylinder cars will have bigger dots in picture.
t<-ggplot(dataset, aes(x=cty, y=hwy,size=cyl))
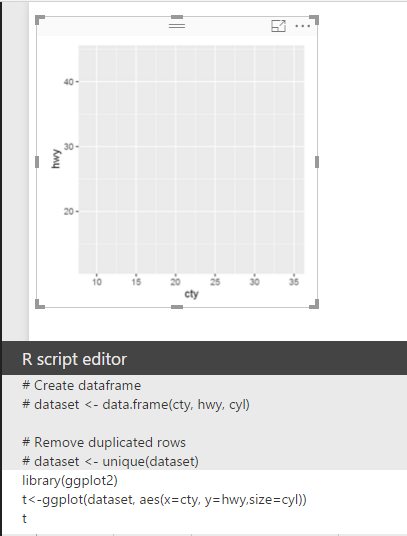
However, this just show the graphs with out any things! we need a dot chart here to create that we need to add other layer with a function name
geom_point, which able to draw a scatter charts, this function has a value as pch=21 which the shape of the dot in chart, for instance if I put this value as 20 it become a filled cycle or 23 become a diamond shape.
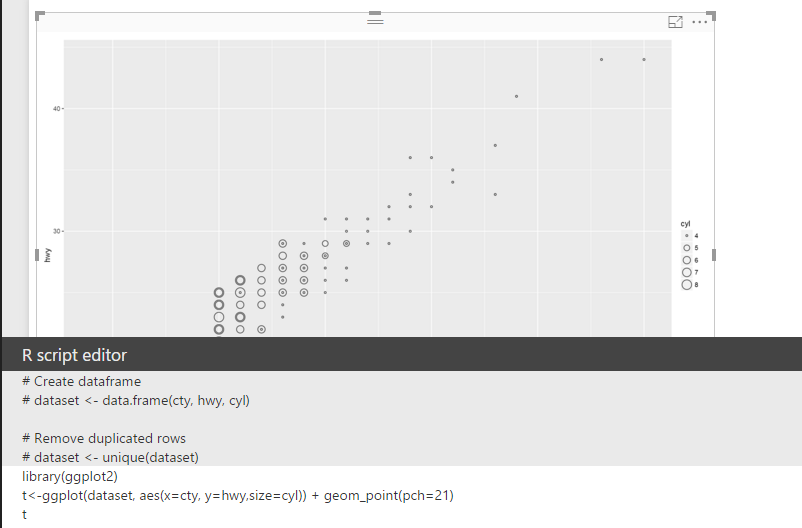
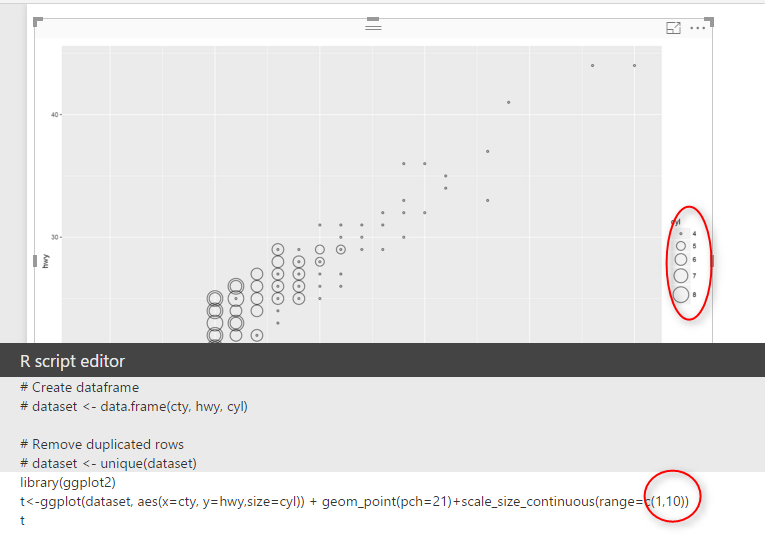
so in the above picture we can see that we have 3 different fields that has been shown in the chart :highway and city speed in y and x axis. while the car’s cylinder varibale has been shown as different cycle size. However may be you need a bigger cycle to differentiate cylinder with 8 to 4 so we able to do that with add another layer by adding a function name
scale_size_continuous(range=c(1,5))
and whole code will be as below :
t<-ggplot(dataset, aes(x=cty, y=hwy,size=cyl)) + geom_point(pch=23)+scale_size_continuous(range=c(1,5))
in the scale_size_continues(range=c(1,5)) we specify the difference between lowest value and highest one is 5, I am going to make this difference bigger by change it from 5 to 10
so the result will be as below picture:
sonow in picture the difference is much. and finally we have below picture
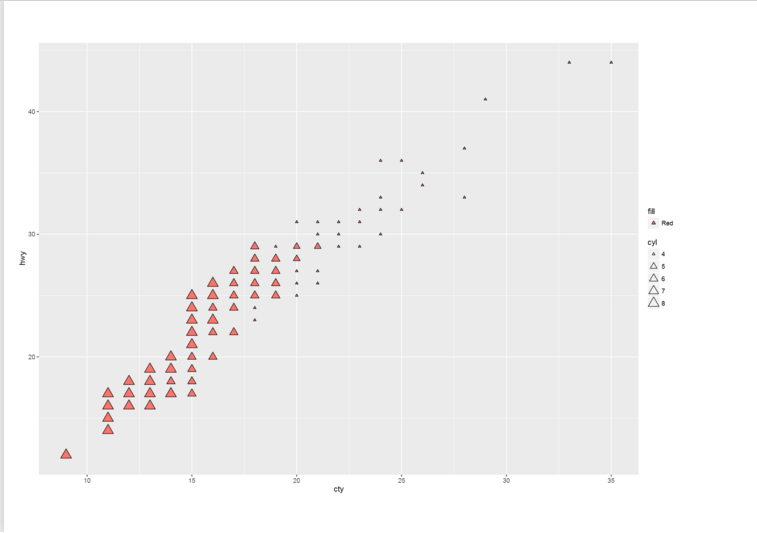
in the other example I have changed the “pch” value to 24 and I add another code inside of ” aes” function name “fill=Red” that means I want rectangle filled in red colour instead
t<-ggplot(dataset, aes(x=cty, y=hwy,size=cyl,fill="Red")) + geom_point(pch=24)+scale_size_continuous(range=c(1,5))
then I have below chart:
It is possible to show 5 different variables in just one chart, using facet command in R. This will help us to have more dimension in our chart, This will be explained in the next post (Part 2).


