
How to use RANKX in DAX (Part 2 of 3 – Calculated Measures)
When I first started to play with DAX, one of the functions that seemed to confuse me more than it should, was how to add ranking to my data. It didn’t seem to matter what the data was, if I followed the online documentation sometimes it would work, while other times the function would return nothing, or just a series of 1’s. This is not a criticism of the documentation either. Probably more a reflection that I was too lazy to digest the information properly.
I have been meaning to write an explanation on how to use the RANKX function, in a way that I would follow – so if this is helpful to you then that would be great.
One of the first traps to encounter when using this function is the function can be used in calculations for calculated columns as well as calculated measures. The RANKX function will still do what it is asked. The trick is how you use the function in each scenario – and more importantly, what filters are going to be implicitly applied to the data the RANKX function actually uses.
For the purposes of this article, I will use the following dataset.
| Category | Sub Category | Date | My Value |
| A | A1 | 2018-01-01 | 2 |
| A | A2 | 2018-01-02 | 4 |
| A | A3 | 2018-01-03 | 6 |
| A | A4 | 2018-01-04 | 6 |
| B | B1 | 2018-01-05 | 21 |
| B | B2 | 2018-01-06 | 22 |
| B | B2 | 2018-01-07 | 23 |
| C | C1 | 2018-01-08 | 35 |
| C | C2 | 2018-01-09 | 35 |
| C | C3 | 2018-01-10 | 35 |
The date used here is yyyy-MM-dd.
The DAX to add this data to your model is the following calculated table:
Table =
    DATATABLE
        (
        "Category"      , STRING ,
        "Sub Category"  , STRING ,
        "Date"          , DATETIME ,
        "My Value"      , INTEGER ,
            {
            {"A","A1","2018-01-01", 2},
            {"A","A2","2018-01-02", 4},
            {"A","A3","2018-01-03", 6},
            {"A","A4","2018-01-04", 6},
            {"B","B1","2018-01-05",21},
            {"B","B2","2018-01-06",22},
            {"B","B2","2018-01-07",23},
            {"C","C1","2018-01-08",35},
            {"C","C2","2018-01-09",35},
            {"C","C3","2018-01-10",35}
            }
        )
I have deliberately added tied values to the data to allow exploring some methods for breaking ties later in this article.
How RANKX works
The syntax for RANKX is as follows:
RANKX(<table>, <expression>[, <value>[, <order>[, <ties>]]])
<table>
The first parameter <table> needs to be a DAX table. This can be a physical table, or it can be the output of a DAX function that returns a table. Like any of the X functions (SUMX, MINX, MAXX etc), the table that gets passed here controls the number of loops, or iterations performed by the RANKX function. If we pass our sample 10-row dataset to the function, the code inside the RANKX function will loop 10 times (once for each row in the table). The smallest number that could be generated is a 1, while the largest value that could be returned is a 10. If we used a function to summarize the physical table, say to the distinct values of the Category column, the RANKX function will logically perform three loops.
<expression>
The next parameter is the <expression>. Think of this as a “Sort by” instruction for the RANKX function. This needs to be a single number – but can be the result of a complex calculation, although more often than not, it will likely be just the SUM over a column for a single or series of rows group together. You can write DAX calculation here that returns a single value.
<value>
This optional parameter is a peculiar one. The quick answer is that if you are just trying to perform some basic ranking, you probably don’t need this. It’s possible to add code here and not get an error, BUT you may also subtly change your ranking order in a way that will be difficult to detect. I will try to explain this in more detail at the end of the article, so until you actually know you need this parameter, I recommend you leave it blank.
<order>
The <order> parameter allows you to swap the ranking between the default that the highest <expression> gets a ranking of 1, with the next highest being 2, to the lowest <expression> being a 1, with the next highest returning a rank of 2. The only two values that can be passed to this parameter are ASC or DESC.
<ties>
This parameter has nothing to do with breaking ties. If you happen to have multiple rows in the <table> that have the same value for <expression>, this parameter will not break ties, or return different ranking values. Once the RANKX function has sorted the <table> by the <expression> and established the order – this function lets you decide if you would like to inject gaps into the numeric ranking sequence in the event of a tie. The sample data-set I use for this article deliberate has some ties so you can see what the RANKX function will return. The only values that can be passed for this parameter are DENSE, which means no gaps in the numeric ranking sequence, and SKIP, which will add gaps.
Using RANKX in a calculated column
The simplest example of using RANKX is as a calculated column. To generate a new column that ranks the values in the My Value column against all other rows in the table, the following calculation can be used.
Rank all rows as Column =
    RANKX(
        'Table',
        'Table'[My Value]
        )
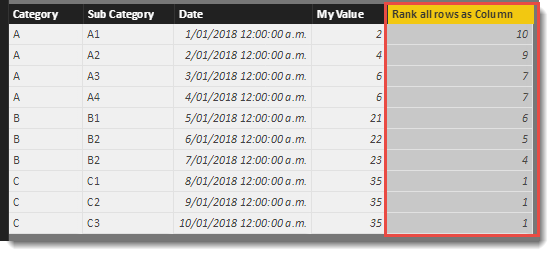
That was easy! The values in the new column have values that correctly rank each row according to the My Value column. The default is the larger numbers have a ranking. Lets have a play with the <order> and <ties> parameters to see the effect these have on our data.
The first change will be to switch the order of the ranking using the <order> function.
Rank all rows as Column =
    RANKX(
        'Table',
        'Table'[My Value],,
        ASC
        )
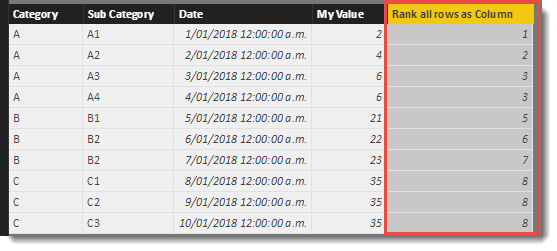
The last column now carries a value that ranks the table based on the My Value column but this time the smallest value has a rank of 1 and the ranking value increases.
Note that the 3rd and 4th rows, share the same value in the My Value column, so therefore have the same Rank of 3. There are no rows with a rank of 4 with the next rank in the column being a 5. This is because there were 2 items tied for 3rd. If there were 3 items tied for 3rd, then the next ranking would be 6.
If you do not want these gaps you can use the <ties> parameter to instruct the RANKX function to keep the numbering sequence contiguous.
Rank all rows as Column =
    RANKX(
        'Table',
        'Table'[My Value],
        ,
        ASC,
        Dense
        )
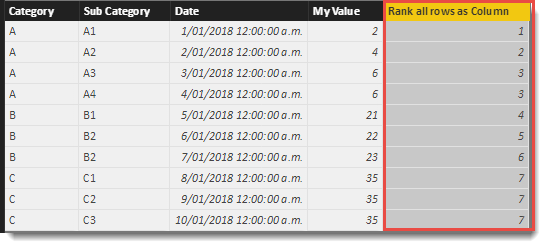
If you scan down the numeric sequence in the final column now, there are no gaps as previous.
Ranking by sub category
Sometimes you would like to rank the order of some items within a category. In our data-set we have a Sub Category column and if the intention is to provide a column that shows the order of these within a Category, rather than overall, the following code can be used.
Rank all rows as Column (Sub Cat) =
    RANKX(
        FILTER(
                'Table',
                'Table'[Category]=EARLIER('Table'[Category])
                ),
        'Table'[My Value]
        )
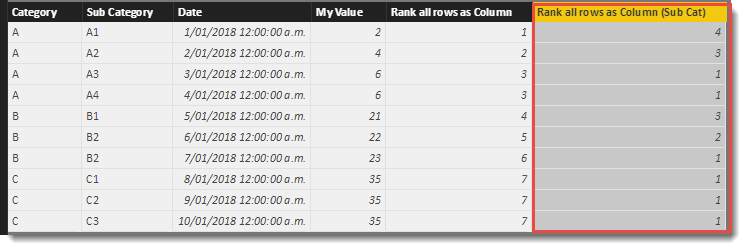
The new column now shows a ranking that resets for every Category. You will notice that the top 4 rows that all belong to the “A” category, are now ranked and do not take into account any of the rows that belong to category “B” and “C”.
This works because we are now using the FILTER function for the <table> parameter to restrict the rows the RANKX Function can use. Originally we were passing the entire 10-row table for the RANKX Function to consider. For the top row in our dataset, we are now reducing this to a 4 row table for the RANKX to consider.
The pseudo logic for this is as follows:
- Generate a new column for our 10 row table and come up with a value for each cell using the following steps.
- For every row in our 10-row table (lets call this the Outer table). Run the RANKX function as per our calculation.
- For row 1 on the Outer table, run the RANKX function using what we know at this point.
- We will pass a <table> to the RANKX function (lets call this the Inner table). Even though the physical table used for Outer and Inner are the same, the RANKX function treats these as two completely separate tables. We are currently on row 1 of the Outer table and have 10 rows in the Inner table.
- The FILTER function is used to reduce the number of rows of the Inner table. The filter condition is that it will only return rows from the Inner table that have a Category of “A”. The ‘Table'[Category] used by the EARLIER function uses the value from the Outer table. This reduces the number of rows from 10 to 4 and it is this 4-row table that is passed back to the RANKX function.
- The RANKX function sorts the 4 row table based on the <expression> using the default sort order. It calculates the <expression> all four times, and notes and returns the ranking for which the <expression> for the current row of the Outer table. For row 1, this happens to be a 4.
- Jump back to Row 3 and repeat the whole exercise for the next row of the Outer table.
This seems quite repetitive but in actual fact, the DAX engine uses smart algorithms to execute the above pseudo logic quickly and efficiently – but it is helpful to understand the logical process, particularly when it comes to nested (outer and inner) tables.
Something else to consider is steps 3 through 7 happen in parallel for the rows in the outer table, which is why breaking ties can be an issue. These steps take place in complete isolation from any other row from the outer table, so if you happen to have the same result for the <expression> parameter – you will get the same result from the RANKX function.
How to break ties
The only way to break ties is to ensure the value returned by <expression> is going to be different. Or said another way, the only way to break ties is to make sure there are no ties. Usually the approach is to scan the other columns for rows that currently produce a tie for the <expression> and look for values that are different and incorporate these into the <expression>.
In my example, I have three rows that belong to Category “C” that all share the same My Value. So far, these rows have always returned the same output from the RANKX function.
I know these rows happen to have different Date values, so I just need to extend my <expression> to incorporate these.
Dates in DAX are simply integer values. The 1 January 2018 is just 43,101 while 2 January 2018 is 43,102.
I know if I divide these values by 100,000 (using dates that aren’t far into the future or past), I will always get a positive decimal value that is less than 1 that I can add to the <expression>. Lets add the code for the <expression> as a calculated column for the purposes of debugging.
Debug Column =
    'Table'[My Value] + (INT('Table'[Date]) / 100000)
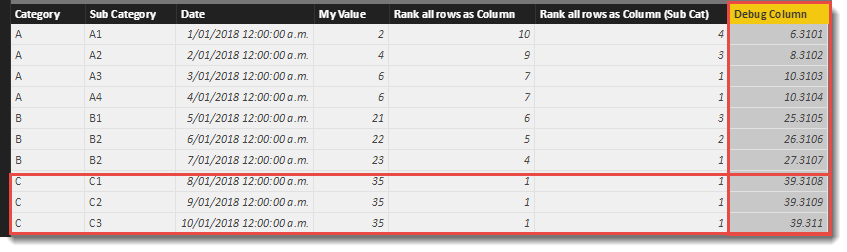
The new Debug Column now has unique values in every row of this data-set. You’ll see now
Things to be aware of when using this technique:
- The amount you add to the original value shouldn’t be larger than the natural step between original values. In this example the My Value column uses integers, so for this data-set I need to make sure I never add a value higher than 1.
- The calculation to adjust for ties needs to consider order. In this case, later dates will return a higher value. Depending on the <order> parameter for the RANKX function, this will either match, or conflict. For this example I would use (1-(INT(‘Table'[Date]) / 10000)) to build the sorting into the calculation.
- Some rows that are tied on My Value may also be tied on Date. In this case, additional columns could be used to extend, or replace the tie breaking logic.
Finally if you really just have to split ties and just don’t care what splits them you can use:
Debug Column =
    'Table'[My Value] + (RANDBETWEEN(1,1E18)/1E18)
Jumping back to the main column, the tie breaking code could look like this
Rank all rows as Column =
    RANKX(
        'Table',
        'Table'[My Value] + (INT('Table'[Date]) / 100000)
        )

This produces a unique ranking for each row of the table, based on the My Value column that uses the Date column to split ties.
The PBIX file used for this blog can be downloaded from here.
https://1drv.ms/u/s!AtDlC2rep7a-ojVYaXf7IhCVSXlG


Hi there!
thank you very much for this amazing post about rankx, it is very helpful for a newbie like me.
However, I copy pasted your code in PowerBI – DAX to replicate it, unfortunately, I am getting the following error:
” A single value for column ‘My Value’ in table ‘Table’ cannot be determined. This can happen when a measure formula refers to a column that contains many values without specifying an aggregation such as min, max, count, or sum to get a single result.”
I am not sure why its giving this error message. Any help will be greatly appreciated
Thanks
Are you loading this as a calculated column or calculated measure?
Hi,
Really good explenation of the Rankx funktion.
I have an issue thought with this. I have a dataset of 75k rows and 4 columns.
When running this funktion to get the Cumulative % based on the ranking the funktion is very slow. I need to be able to filter on each of these columns in the dashboard as well.
Do you know if there is any way to increase the speed?
Thanks!
This was the most helpful write-up on RANKX()….thank you so much.
PERFECT!!
EXACTLY WHAT I WAS LOOKING FOR!!!
THE BEST EXPLANATION I FOUND!!!
THANK YOU!!!
I have really struggled with this function previously but when studied your pseudo logic it quickly became clear. Thanks for taking the time to write this up!
Thank you so much… again! I always find solution for my issues here!
I’m new to DAX. I’m using Excel Power Pivot (not Power BI). Can i create this table there? I’m confused by this because I don’t see where to insert the Table= code
Yes, you can create calculated tables in Power Pivot too. they are marked with tables with fx meaning they are calculated
Cheers
Reza
Brilliantly explained, thank you!!