
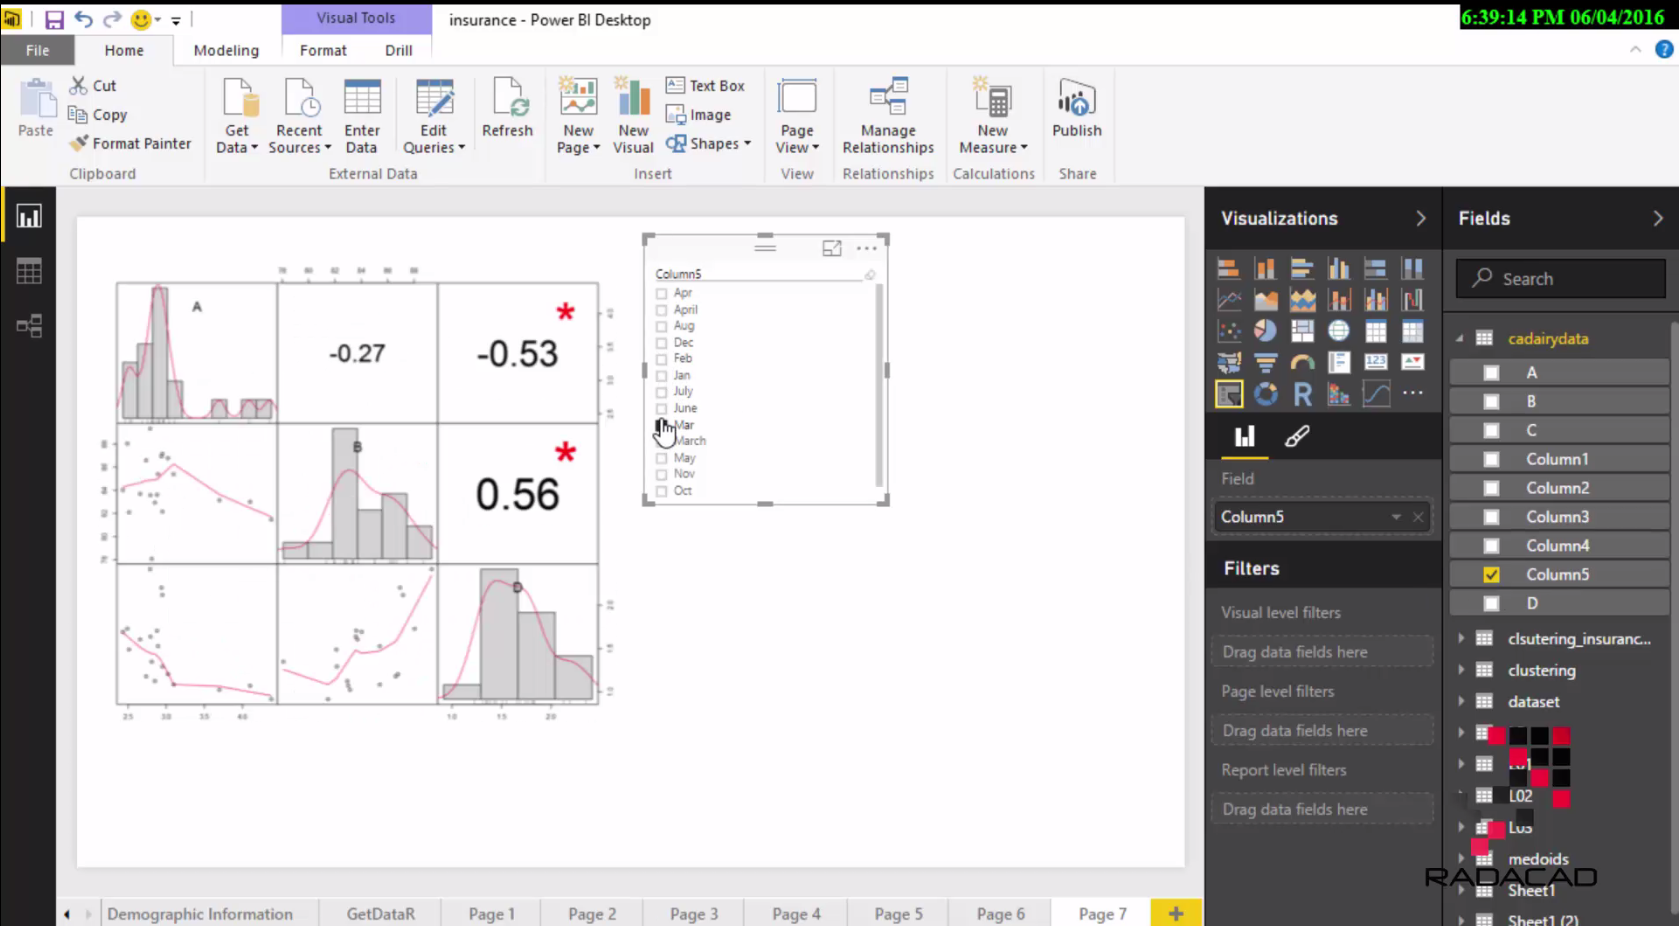
In previous videos you’ve learned that we can demonstrate R visualization in Power BI, In this video you will learn how R visualization is working interactively with other elements in Power BI report. In fact Power BI works with R charts as a regular visualization and highlighting and selecting items in other elements of report will effect on that. Here is a quick video about this functionality;
If you would like to learn more about Power BI read Power BI online book; from Rookie to Rock Star.


Trainer, Consultant, Mentor
Leila is the first Microsoft AI MVP in New Zealand and Australia, She has Ph.D. in Information System from the University Of Auckland. She is the Co-director and data scientist in RADACAD Company with more than 100 clients in around the world. She is the co-organizer of Microsoft Business Intelligence and Power BI Use group (meetup) in Auckland with more than 1200 members, She is the co-organizer of three main conferences in Auckland: SQL Saturday Auckland (2015 till now) with more than 400 registrations, Difinity (2017 till now) with more than 200 registrations and Global AI Bootcamp 2018. She is a Data Scientist, BI Consultant, Trainer, and Speaker. She is a well-known International Speakers to many conferences such as Microsoft ignite, SQL pass, Data Platform Summit, SQL Saturday, Power BI world Tour and so forth in Europe, USA, Asia, Australia, and New Zealand. She has over ten years’ experience working with databases and software systems. She was involved in many large-scale projects for big-sized companies. She also AI and Data Platform Microsoft MVP. Leila is an active Technical Microsoft AI blogger for RADACAD.
2 thoughts on “Interactive R Charts in Power BI”