
An essential step towards a better analytics solution is to know your data. You have to know your data to be able to determine key columns, to learn what transformations need to be done, and etc. Power Query provides a very useful way of knowing your data in Power BI. Power BI has features for column profiling, column distribution, and column quality. All of these features are helpful to familiarize you with the data. In this blog and video, we’ll have a look at these options and how to use them.
Video
Power Query Editor
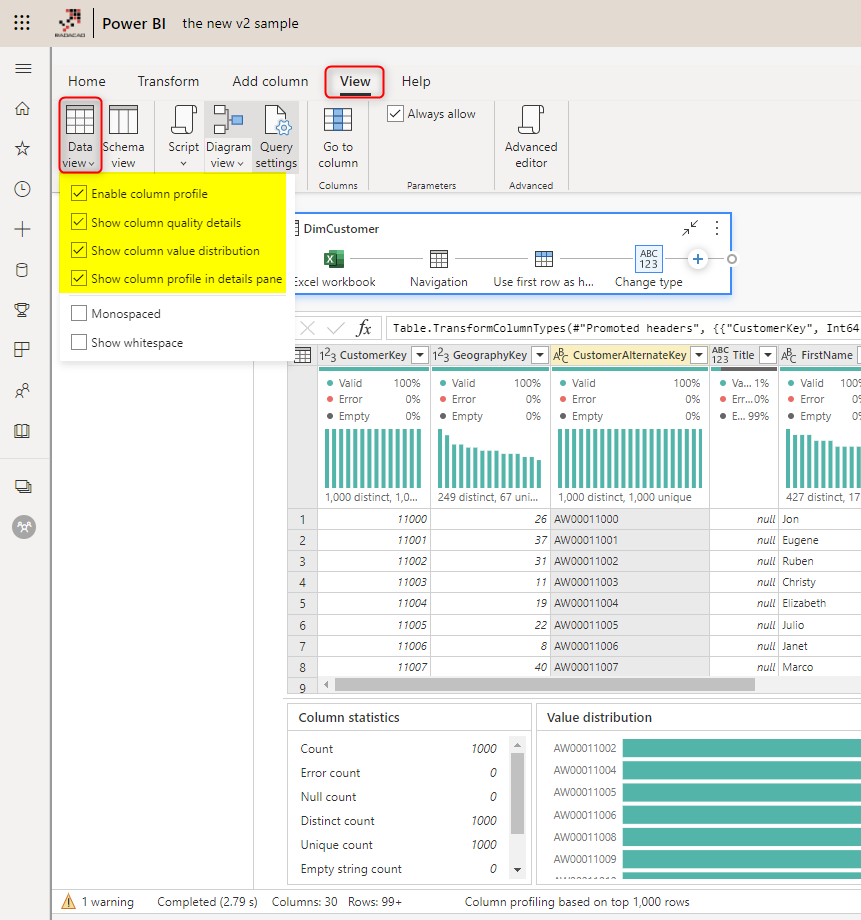
Column profiling, distribution, and quality are all Power Query features. You have to go to Power Query Editor window using the Transform Data in Power BI Desktop.

Column Quality
Often you have applied some transformations and you want to know if you have any errors or empty values in your columns. there is a bar at the top of the column, right under the column header, which will give you some information about it.
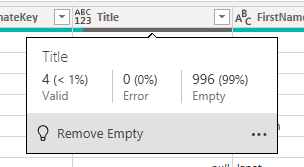
The information provided includes the number of Error, Empty, and Valid data cells in that column and their percentage. There is a simpler way to see this for all columns in the table. You can enable the Column Quality in the View tab in the Power Query Editor.

This can be particularly helpful if you have applied a transformation, and want to check if any rows return an error as a result. Here is an example of a transformation that caused an error.
Column Profiling Based on the entire dataset
However, you have to be careful that the column profiling by default is based on the top 1000 rows. You can see this at the bottom of the Power Query Editor window.

You can change this by clicking on it and choosing the Column profiling to be based on the entire dataset.

This might look like a very cool option to enable, but be careful that if your table size is big, then this will slow down the Power Query Editor window. I suggest only enable it when needed, and immediately change it back to the top 1000 rows.
Column Distribution
Another useful point to know about the data in a column is to see how the values are spread. Column distribution is helpful information for that, which can be enabled under the View tab in the Power Query Editor.
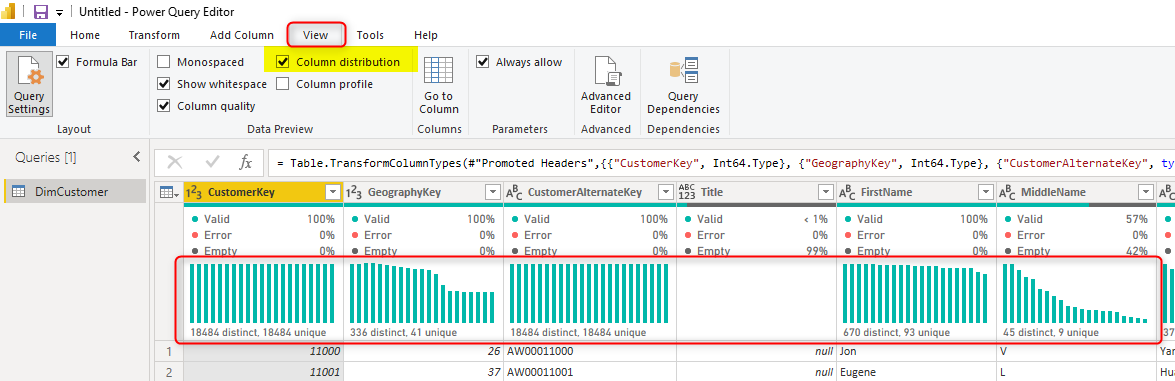
However, reading the values in detail in the small charts is a bit hard. This is why Column Profile can help.
Column Profile
Column profile includes the count of errors and empty values, it also includes the distribution of values in the column. However, the column profile includes much more information too. Information such as the minimum, and the maximum values, count of unique values, and the distribution of values in detail. In fact, the column profile is a much more complete version of the other two options.
You can enable the column profile from the View tab in the Power Query Editor.
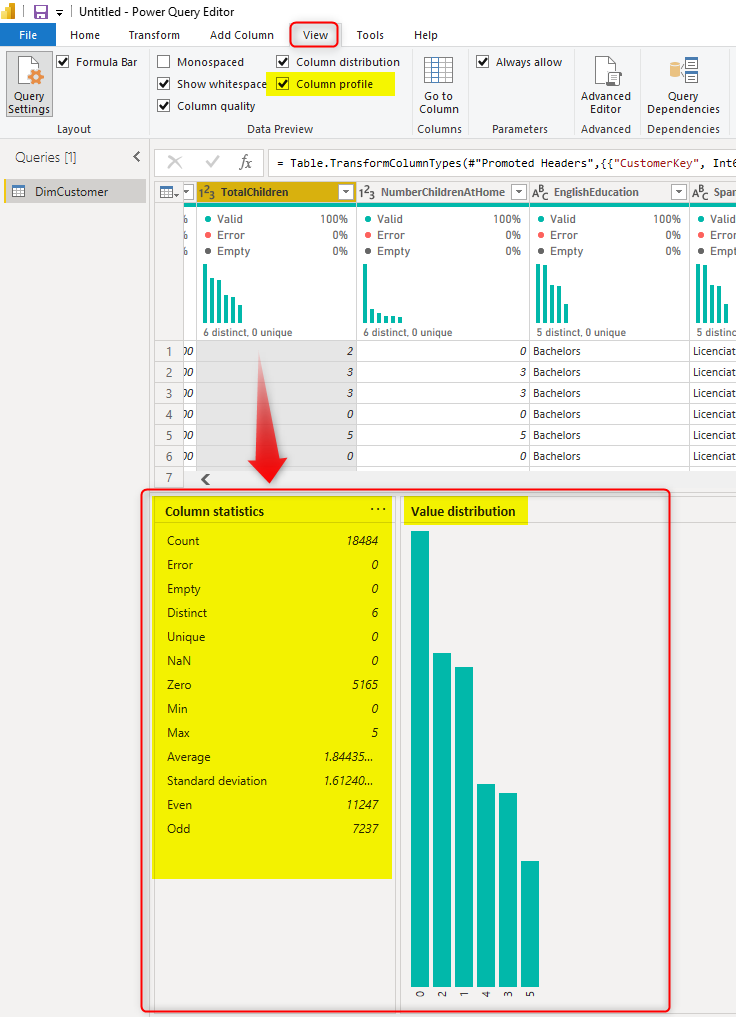
In the column profile above, you can see the distribution of values in the TotalChildren column, you can see more customers with no children and fewer with five children. You can also see the count of rows, errors, and empty values. As well as the min and max value in the column, the count of Even and Odd values, and much other information.
Knowing the information above is very helpful for a data engineer. Because you can apply the right transformation and target the right data values based on it.
Power Query Online
All of the profiling information above is also available in the Power Query online, you can find it in dataflow’s Power Query Editor
Performance Consideration
Data Profiling, quality, and distribution are great features to know your data better. However, having them enabled all the time is not recommended especially if you have large tables. This will make your development experience inside the Power Query Editor much slower. I do recommend enabling these features only to learn more about the data in the column and disable it soon after. These features will not impact the performance of the report though, because they are developer-only features inside the Power Query Editor.
Data Profiling in Power BI reports
Data Profiling is in Power Query Editor, it is not for the end-user. It is for the data engineer to be able to know the data. However, If you ever need to bring the data profiling information into a Power BI report, and enhance the user experience by providing the profiling information, I have written a blog article about how to do that here.
I also suggest you look at how to create an exception report in the Power BI article here.
Column profiling is an important part of knowing your data better, and the features above can help you with that.


Reza is author of more than 14 books on Microsoft Business Intelligence, most of these books are published under Power BI category. Among these are books such as Power BI DAX Simplified, Pro Power BI Architecture, Power BI from Rookie to Rock Star, Power Query books series, Row-Level Security in Power BI and etc.
He is an International Speaker in Microsoft Ignite, Microsoft Business Applications Summit, Data Insight Summit, PASS Summit, SQL Saturday and SQL user groups. And He is a Microsoft Certified Trainer.
Reza’s passion is to help you find the best data solution, he is Data enthusiast.
His articles on different aspects of technologies, especially on MS BI, can be found on his blog: https://radacad.com/blog.