
If you are showing an important measure value in the report, and you want to compare it with a target and see if it meets the target or not, The KPI visual comes in handy. The KPI Visual’s behavior, however, might be a bit hard to understand, In this article and video, I explained how this visual works, and how you can use it in your reports.
Video
What is KPI?
KPI or Key Performance Indicator is a measure for businesses to understand how they perform in a specific area that is important and many times critical for their business. For example, they would like to see how the current year-to-date sales are going against what they estimated? Is it higher or lower? What is the trend? Is it going upward or downward? There are some visualization options to show KPIs, and from them, the most commons are; Gauges, Charts with arrows that show upward or downward, and color codes of red, amber, or green (visualizing the status).
I have previously written about some options of custom visuals for representing KPIs, you can read about it here. In this article, however, we focus only on the built-in KPI visual in Power BI.
KPI Elements
KPIs measure something and show trends and status. So they have components to work with as below:
- Value; The main measure which we want to evaluate
- Target; What we want to compre the Value with
- Trend; How Value perfoms in a time period, is it going upward, downward…?
- Status; What is the current status of Value against Target?
KPI Visual
KPI visual is a built-in visual in Power BI that can be added to the report from the Visualization panel.
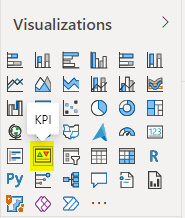
This visual works with three KPI elements; Value, Trend, and Target.
Value is here named as Indicator. Let’s see how this can work in a report. Imagine that you want to evaluate the sales and compare it with a target. In this case, Sales will be the Indicator;
I have a simple measure for Sales as below:
Sales = sum(FactInternetSales[SalesAmount])
And a simple target measure here too:
Target = 300000
As you can see, the target in my example is static. However, it can come from a table if you want it.
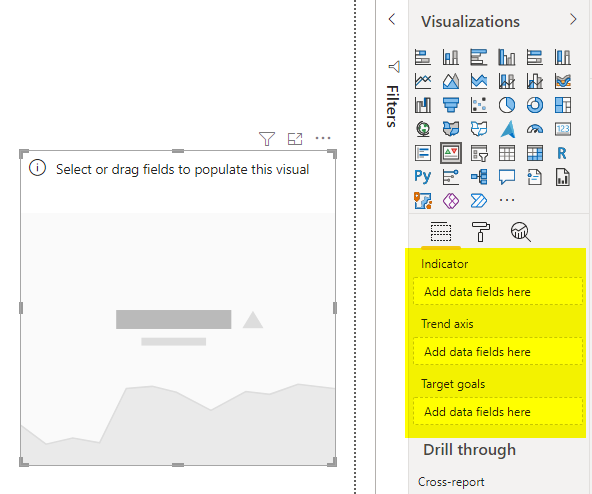
If I use that in the KPI visual, I won’t get any promising results;
This means you need at least the Indicator (Value) and the Trend to get this chart working. Let’s say for example I want to see the trend of sales for months, this way, I can add Month as the Trend axis here. I remove the Target, for now, to make it simpler to understand.
Trend
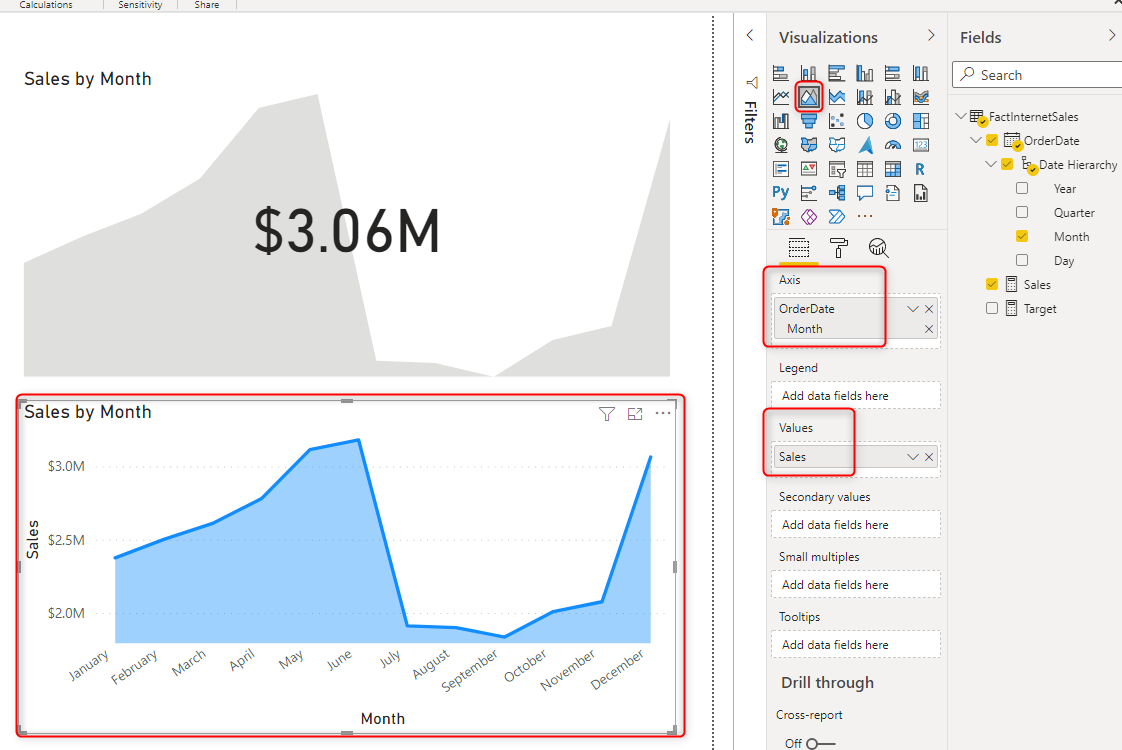
If I use Month as the Trend, then I will get an area chart in the KPI visual’s background and a Value showed up;
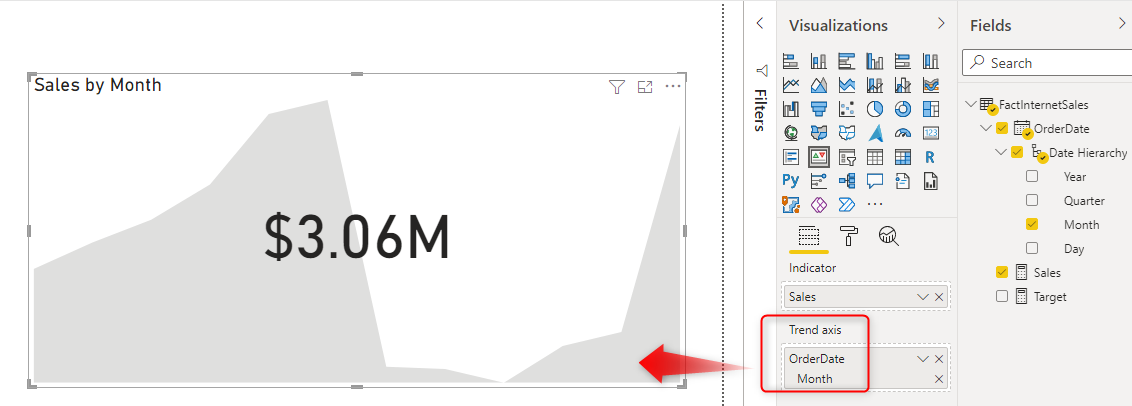
This means the Month here is used as the axis of the area chart, and the value shown on it is whatever the Indicator is. In this example, the Indicator is Sales. So the area chart shows Sales by Month. This is similar to creating an area chart with the Month as axis, and the Sales as value;
If you don’t want this representation of the area chart inside the KPI visual, you can turn it off, or change the transparency in the formatting of the KPI Visual;
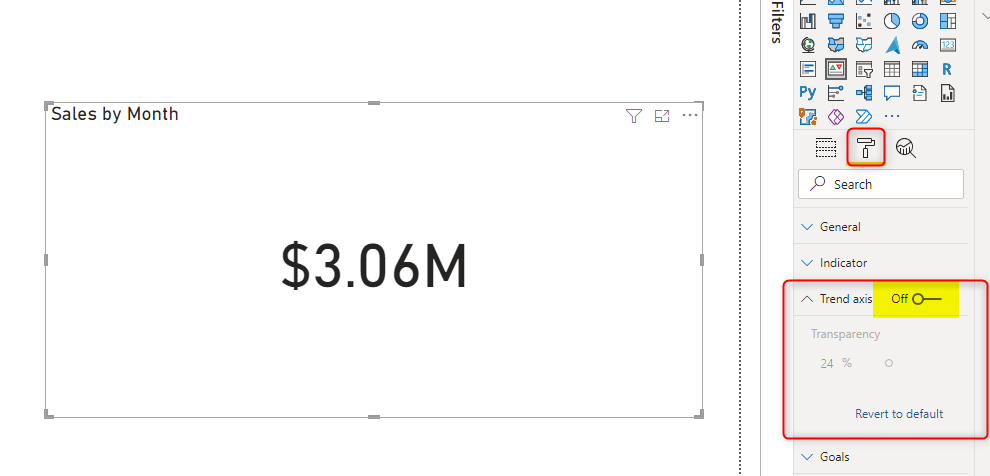
If you turn off the Trend, the KPI visual looks like a card visual, but with some more information (still to come later in this article).
Indicator
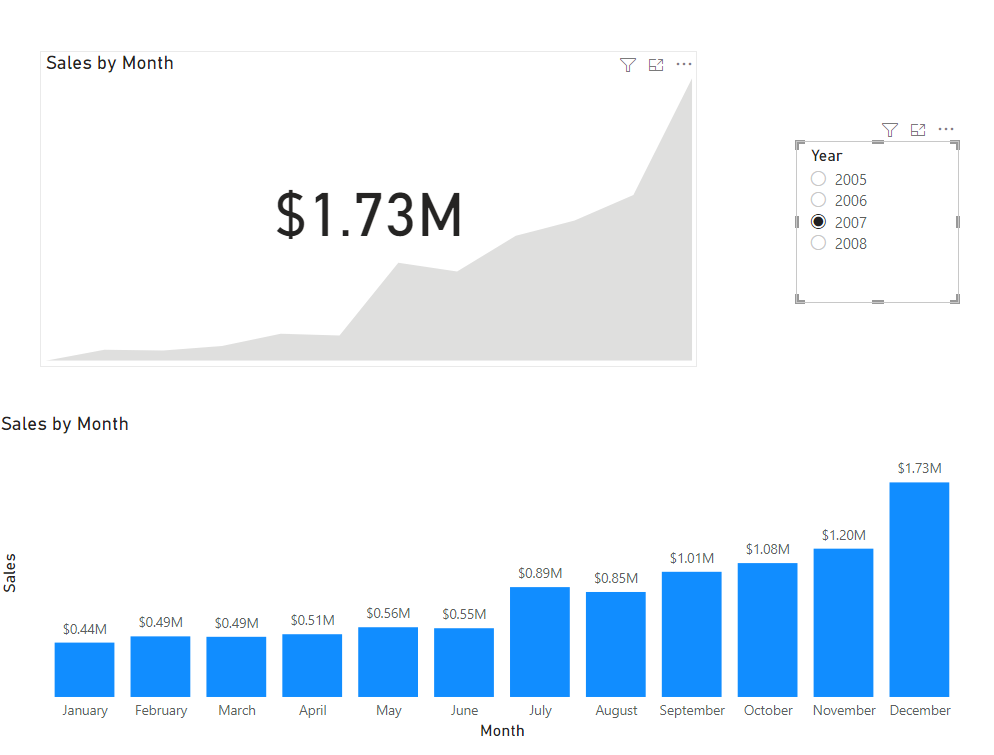
We used Sales as the Indicator in this visual, this means the main value represented in this visual will be Sales. But is that the total sales? Or filtered by something? The value represented in the center of the KPI visual is the Indicator’s value as of the last data point shown in the Trend axis. What does that mean? That means if the Trend is month, then this is the Sales of the last month only.
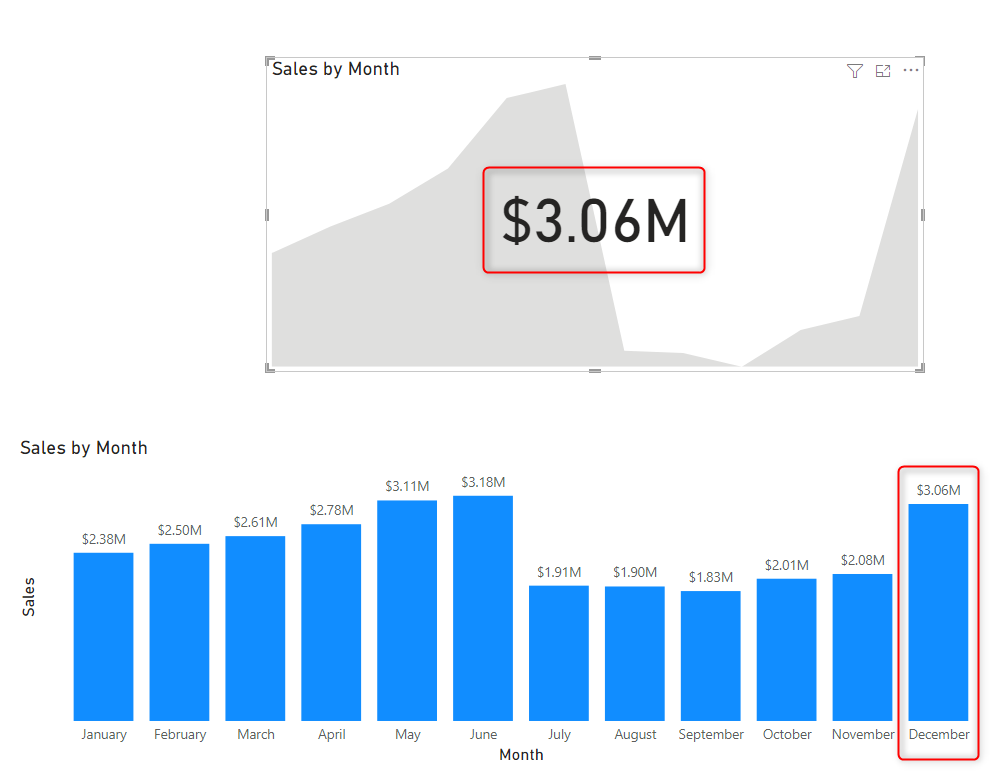
I just added the column chart to show you that the value represented in the KPI Visual is just for the last month. Because in my report I don’t have any filters. This means this is the sales for the December of all years. If I add a filter for the year, then It would be for December of the given year in the slicer.
To learn how to set the slicer to single-select (like the screenshot above) read my article here.
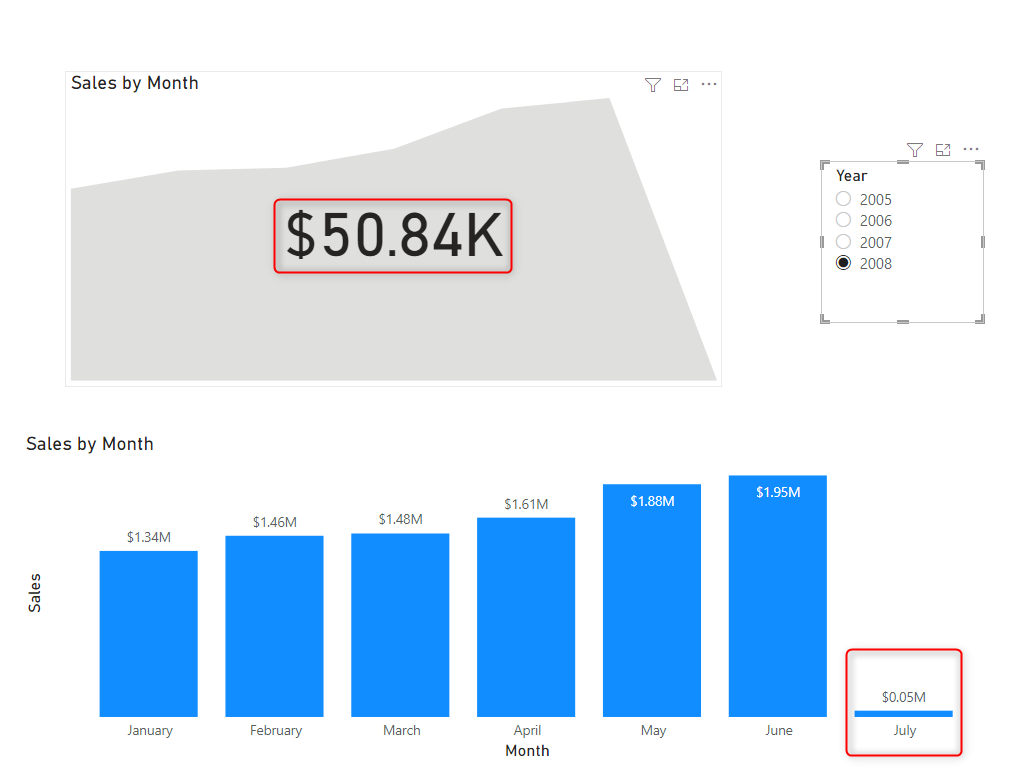
So the last month’s sales are represented in the KPI visual, but what the last month is actually? That can be obvious if the year is full (December), but if we have sales only in some months but not all, then it can be a challenge;
There is a useful additional option for KPI visual in the formatting called Date, which you can enable, and it shows the Date of indicator value.

This option can be set from the Format > Date, as you can see in the above screenshot.
Target
Everything done so far in this visual is about presenting what has happened, and not comparing it with anything. When you want to compare it with a value, Target comes in handy. In my example, the target is a static value of course, but it can be populated dynamically from a table.
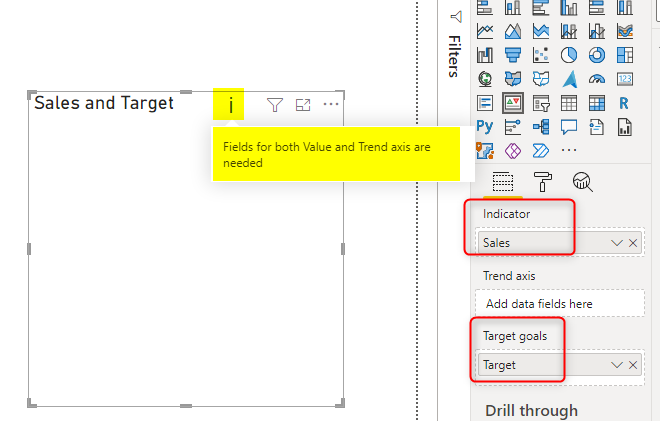
If I add the target, then there will be also a color-coding on the visual at the same time
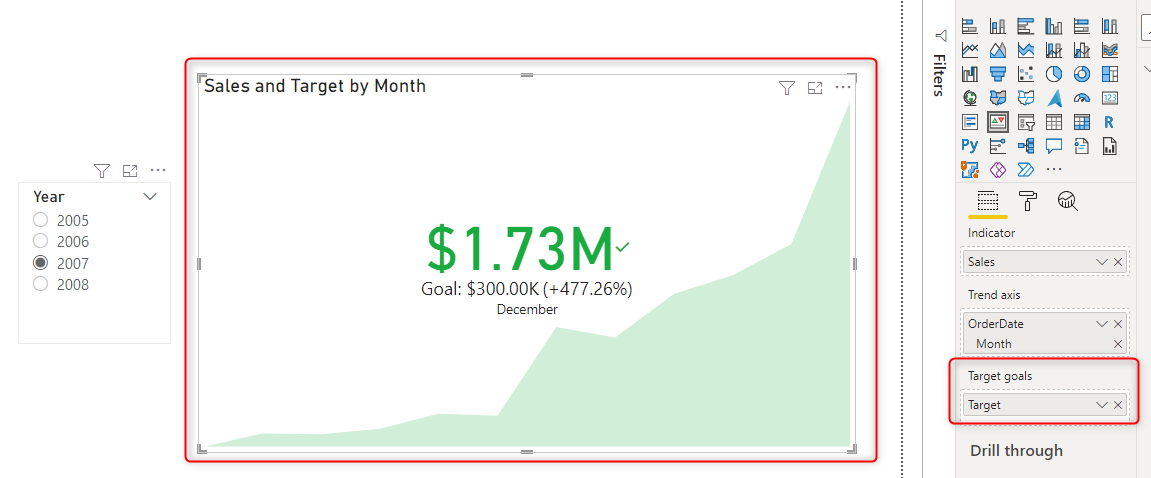
In the screenshot above, you can see that adding the target for the year 2007 changed the color to green in both the indicator’s value and also the area chart. It also added a small checkmark beside the value. These are all added because the value (Indicator) meets the target and is more than that. For December 2007, the Sales value is $1.73M, while the target is $300K. The target is represented as the Goal. and the percentage difference of the Sales (Indicator) and the Target is also represented there.
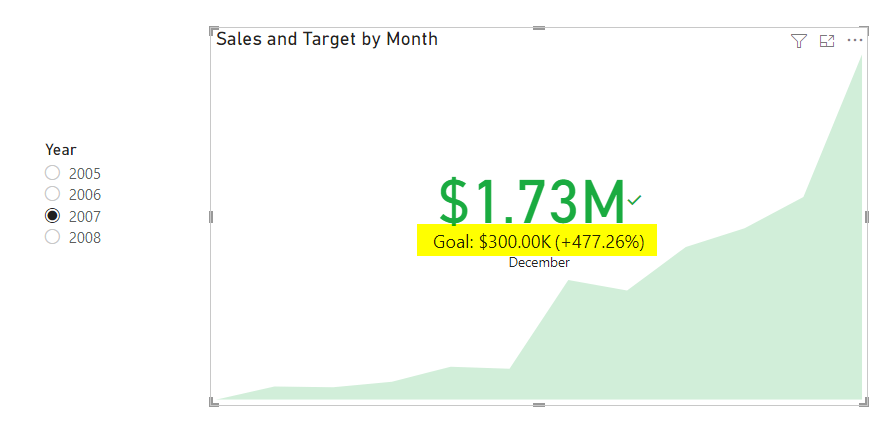
This is very useful information, you didn’t write any calculation or add a new visual to show it. KPI visual shows it all.
If you don’t like this extra information, however, you can customize it in the Format of the visual, under Goals

You can enable or disable the Goal or the Distance or both. You can also change the formatting of the goal and distance in the same place.
Another configuration related to the target is the color-coding, which can be configured from the Format > Color coding;
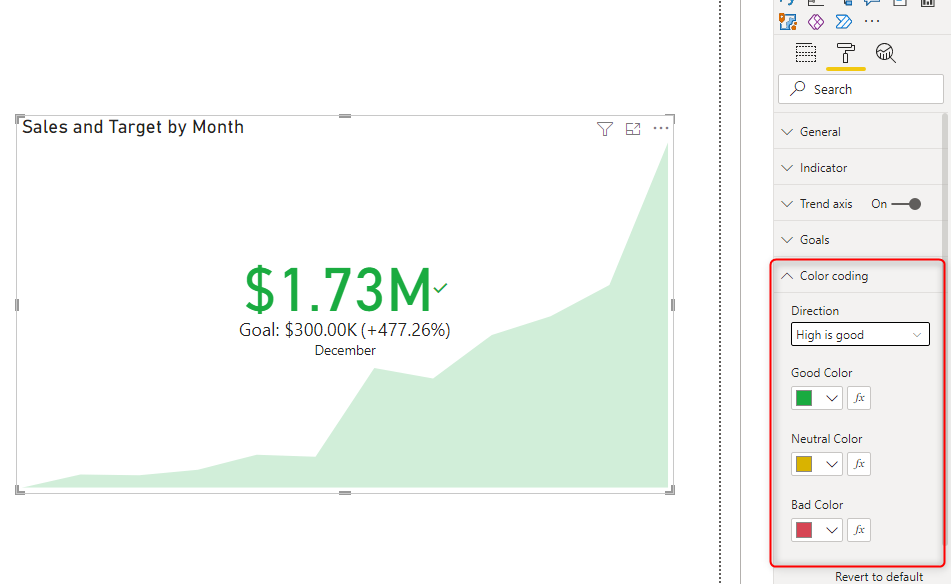
Depending on the nature of the indicator, you may choose “High is good” or “Low is good”. For example, For something such as Sales, the more the merrier. So High is good. But for something such as Expense, the less is better, so Low is good. You can then choose the sentiment colors as you wish.
Another option for color-coding is to use conditional formatting with DAX measures which will take the color-coding to the next level, and you won’t be limited to three sentiment colors with that, you can do whatever you want. to learn more about it, read my article here.
Summary
KPI visual is a useful and efficient visualization in Power BI. It shows a KPI value compared with the target with the color-coding and the distance to the target, and all of that in one visual. The area chart represented also shows the trend of that value over time. This combination makes KPI visual a useful option when it comes to showing critical measures in a report or dashboard. Let me know about your experience with this visual in the comments below.


Reza is author of more than 14 books on Microsoft Business Intelligence, most of these books are published under Power BI category. Among these are books such as Power BI DAX Simplified, Pro Power BI Architecture, Power BI from Rookie to Rock Star, Power Query books series, Row-Level Security in Power BI and etc.
He is an International Speaker in Microsoft Ignite, Microsoft Business Applications Summit, Data Insight Summit, PASS Summit, SQL Saturday and SQL user groups. And He is a Microsoft Certified Trainer.
Reza’s passion is to help you find the best data solution, he is Data enthusiast.
His articles on different aspects of technologies, especially on MS BI, can be found on his blog: https://radacad.com/blog.
Is there any way to export everything we see (tables, graphs,etc) in the dashboard to excel?
you can export data only. but if you want visualization export, export to PDF or PowerPoint from the website is your best option.
Hi, in my KPI visuals when I select more than one month I only see data from the last month in the visual.
My goal is when I select multiple months, I want to sum that data, is that possible?
Thanks
Hi
KPI visual always shows the value of the last item. in your case last month, because the month is perhaps your trend value
if you want the sum of months, then I suggest using a normal card visual with conditional formatting.