
In the Part one I have explained the main concepts of Market basket analysis (associative Rules) and how to write the code in R studio. In this post I will explained the process of doing market basket analysis in Power BI.
for doing this post I have used the data set from [1].
Power BI Desktop, is a self service BI tool. you can download it from below link;
https://powerbi.microsoft.com/en-us/
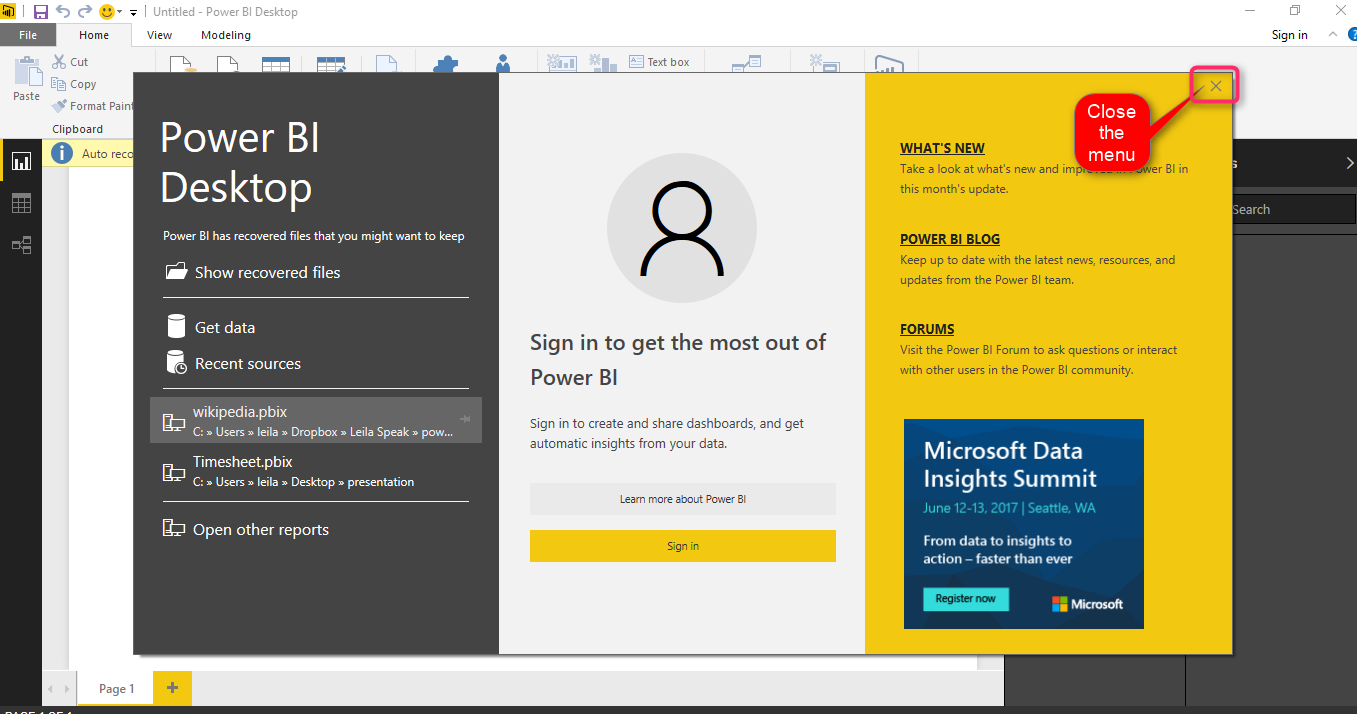
to do the market basket analysis, I first create a new Power BI file
Power BI is a great tools for visualization and cleaning data, most of data wrangling can be happen there. most of data cleaning like remove missing variables, replace values, remove columns and so forth.
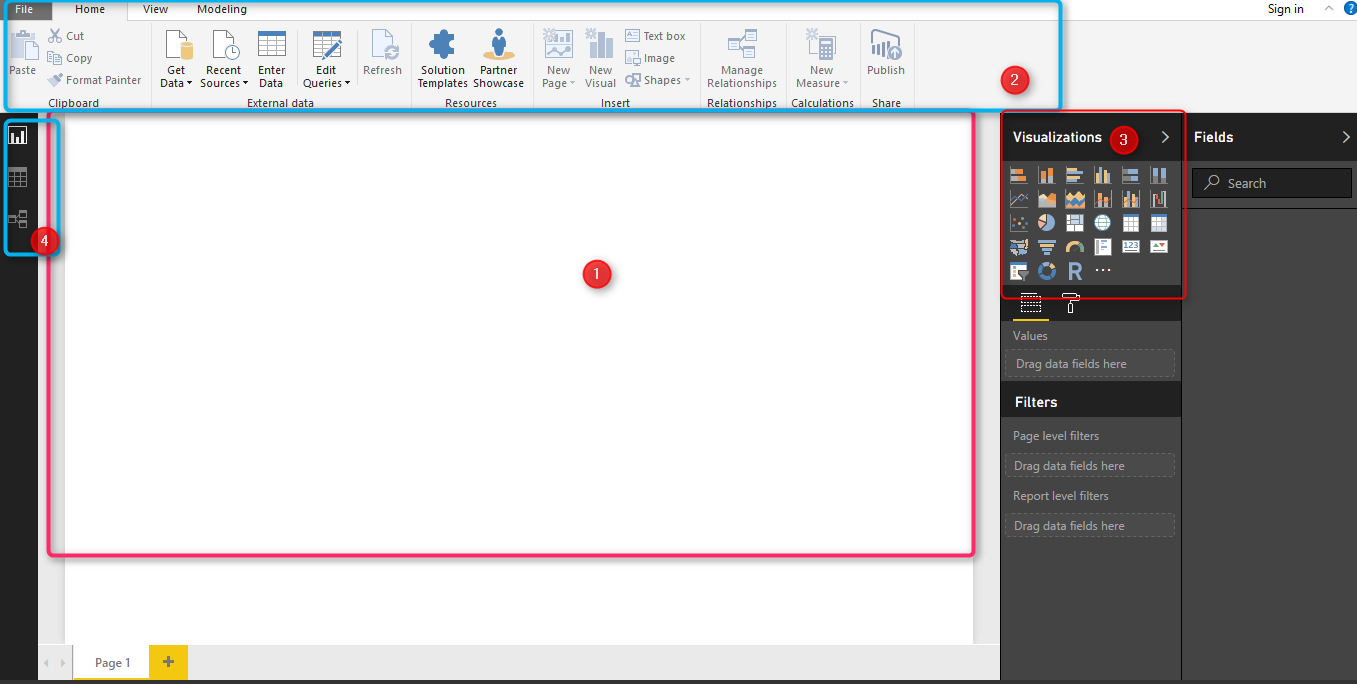
the middle area is for creating reports (Number 1). At the top, the main tools for creating reports, data wrangling, and so forth is located in number 2.
Moreover, the report elements like bar chart pie chart and so on has been shown in right side (number 3). finally, we able to see the relationship between tables and data in left side (number 4)
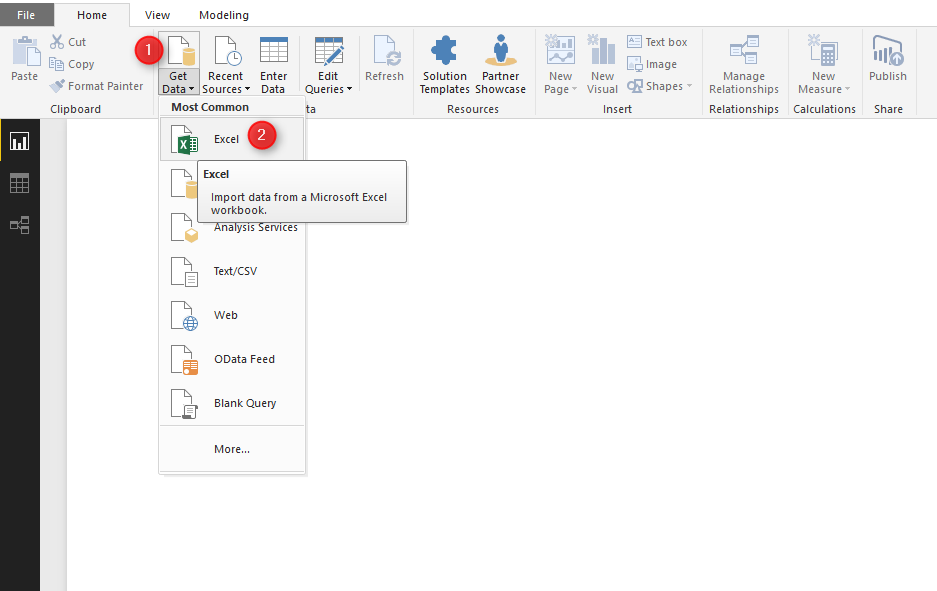
We get data from excel (local PC), so click on Get data in top menu and choose Excel from sources. as can be see in below picture.
after loading the data set, now we can see the transaction shopping data for each customers (see below pictures).
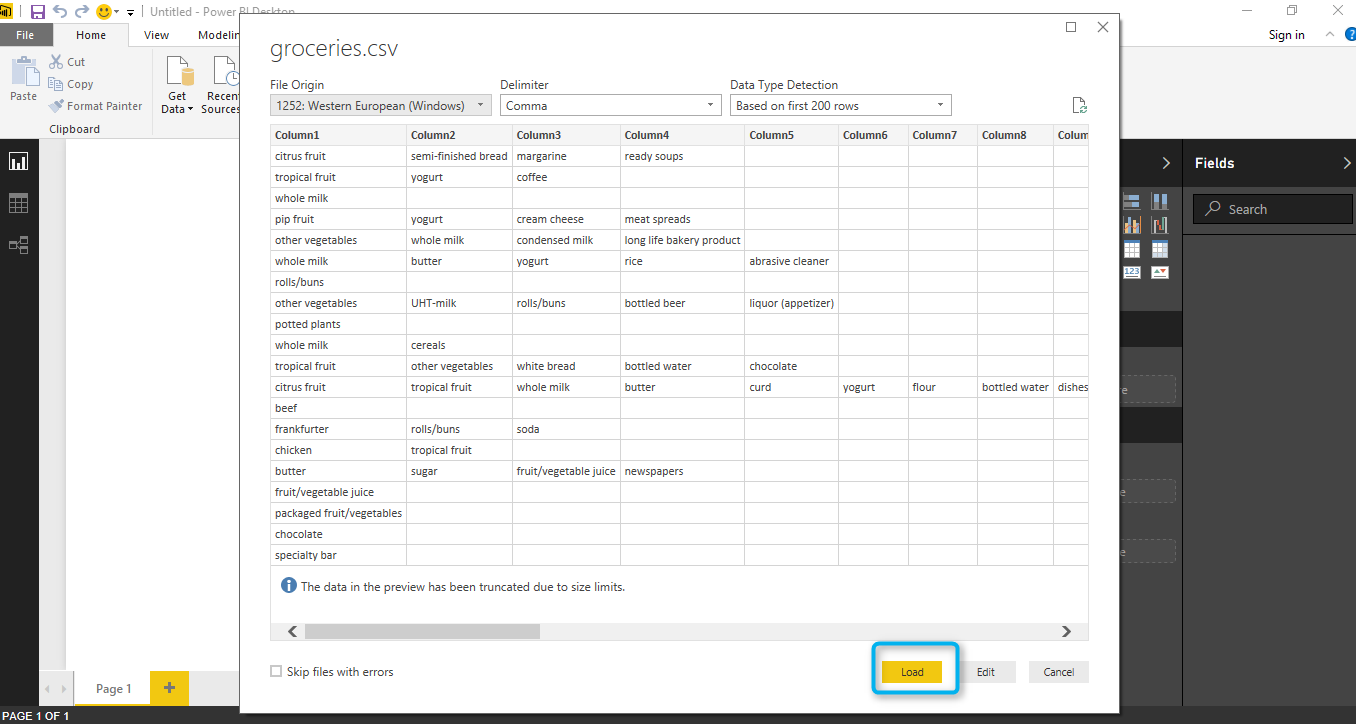
so, we click on load option to get data from local pc into power bi.
then we want to do Market Basket analysis on data to get more insight out of it. In power bi, it possible to write R code!
first you should install a version of R in your pc. I already installed Microsoft R Open 3.3.2. from
https://mran.microsoft.com/open/
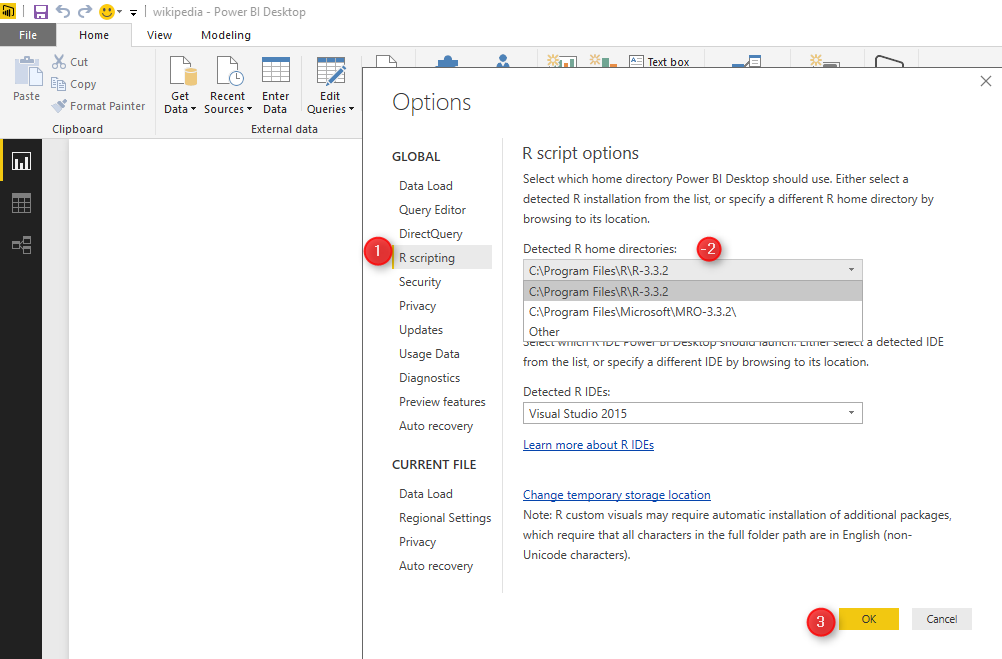
after installing R in your machine, in power BI you should specify the R version. to do that, in Power BI, click on “File”, then “Options” (below picture)

Then in “Global”, find he “R scripting”. In R scripting, Power Bi automatically detect the available R version in your PC. It is important that you select the R version that you already tested your R code there. as when we install a package in R, in Power BI that package is also become available, so there should be some connectivity between R version that you run your code and then one you select in power BI.
Now we want to write Market Basket analysis code in Power BI. To do this we have to click on “Edit Query” and then choose ” Edit Queries” from there.
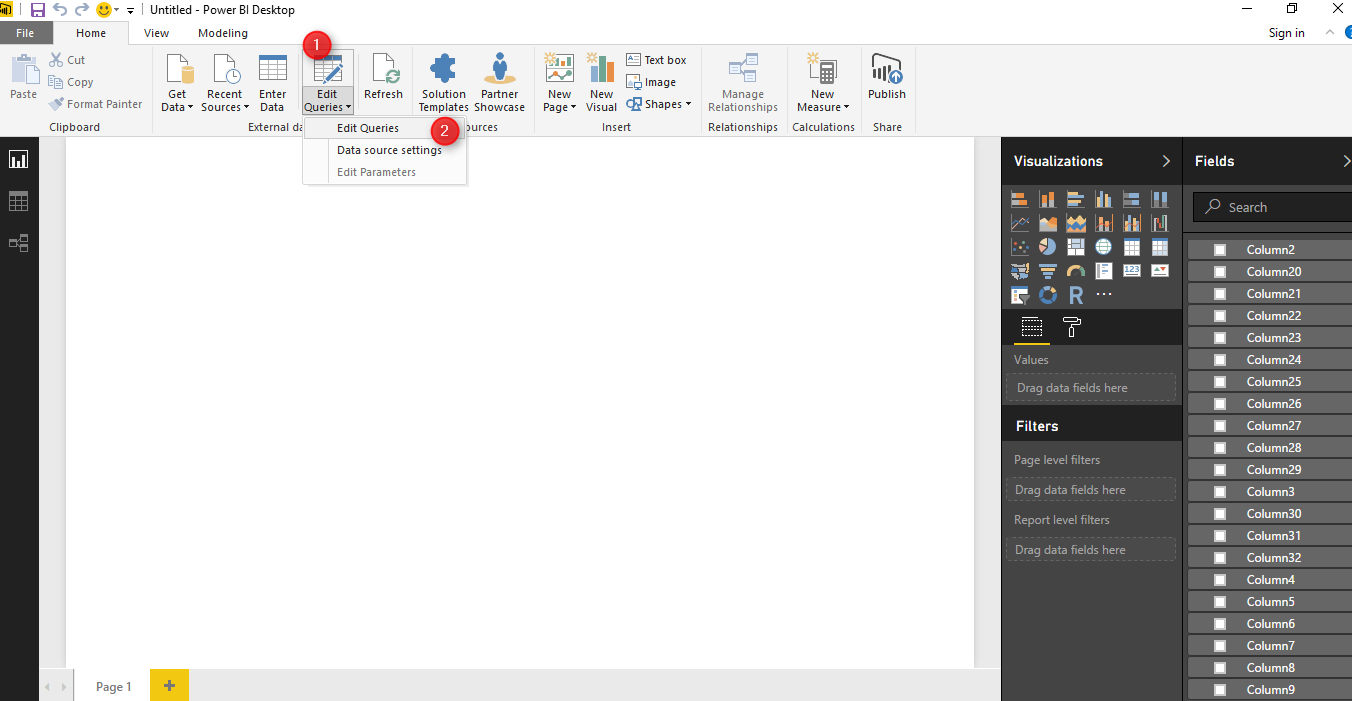
After selecting “edit query” , you will see the query editor environment. in top right, there is a “R transformation” icon.

By clicking on the “R transformation” a new windows will show up. This windows is a R editor that you can past your code here. however there are couple of things that you should consider.
1. there is a error message handling but always recommended to run and be sure your code work in R studio first (in our example we already tested it in Part 1).
2. the all data is holding in variable “dataset”.
3. you do not need to write “install.packages” to get packages here, but you should first install required packages into your R editor and here just call “library(package name)”
so we have below editor
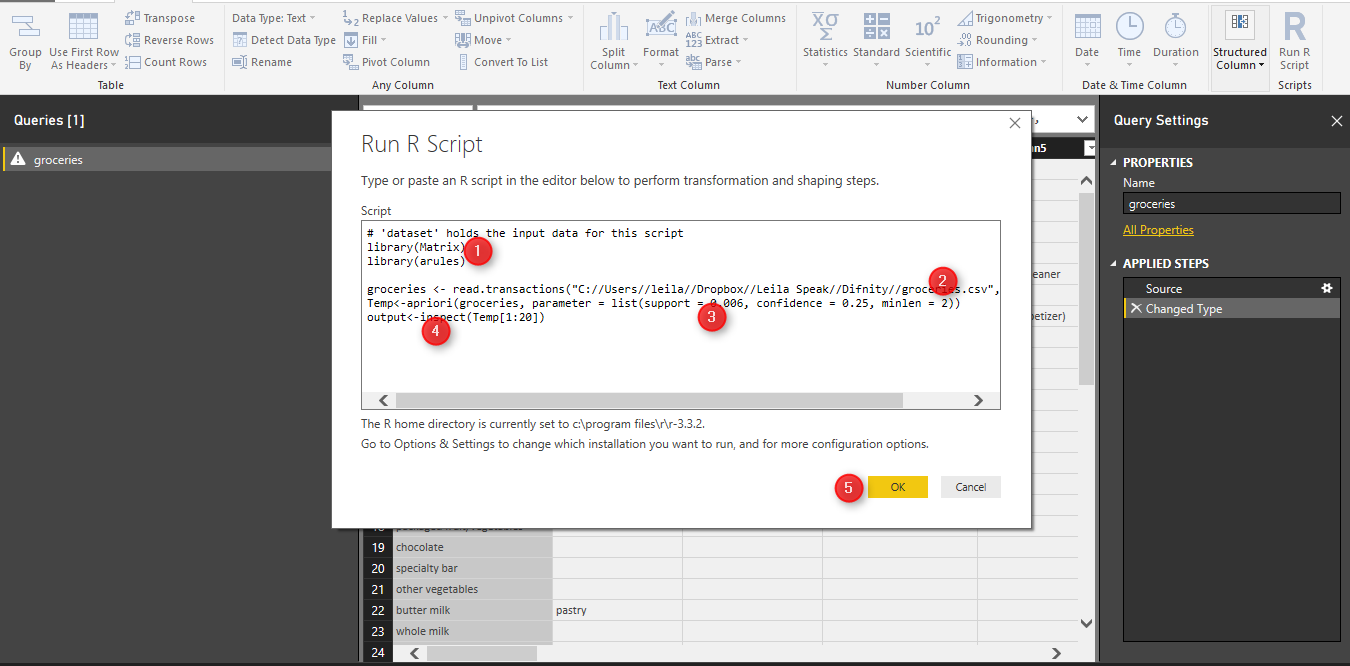
for doing market basket analysis I need two main libraries: “Matrix” and “arules”, hence I wrote two line code to have these libraries here:
library(Matrix)
library(arules)
then as the data is not in format of transaction I have to reload the data from my PC again to make them as transaction type by writing below code
groceries <- read.transactions("C://Users//leila//Dropbox//Leila Speak//Difnity//groceries.csv", sep = ",")
then, call the “apriori” function to find the rules in customers shopping behaviour. apriori get the dataset “groceries” as input, also it accepts the parameters like support ,confidence , and minlen. the output of the function will be in “Temp” variable
Temp<-apriori(groceries, parameter = list(support = 0.006, confidence = 0.25, minlen = 2))
now we inspect the first 100 rules by calling the “inspect” function and put the output of function in “Output” variable.
output<-inspect(Temp[1:100])
output variable is the result of the query.
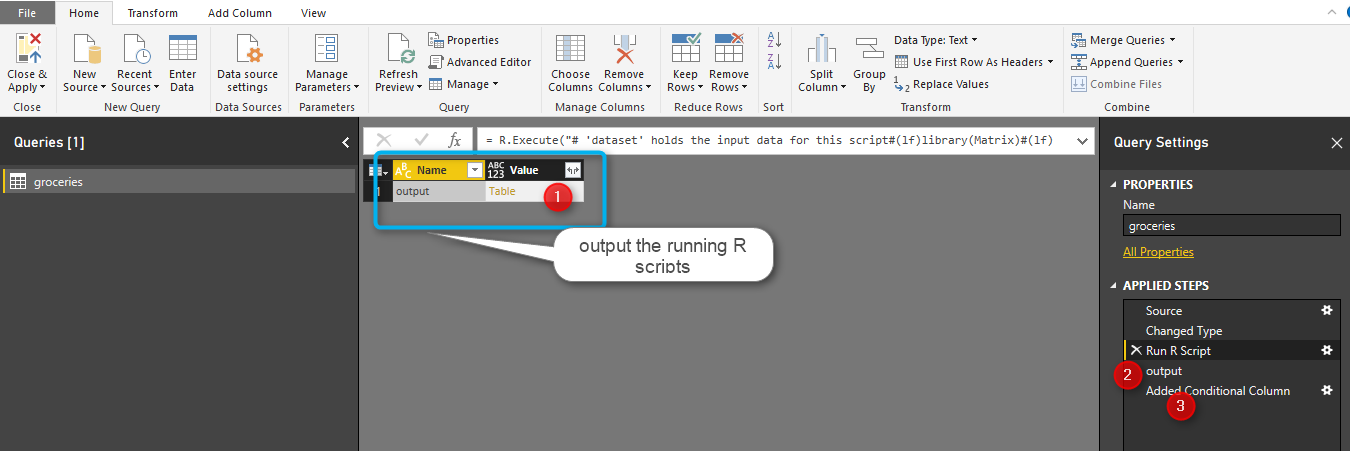
after clicking on the “Output” (above picture number 1), we will see the below results. the result of finding rules in customer behavior has been shown in below image. the first column (lhs) is the main item that people purchase the third column (rhs) is the related items to (lhs). the support, confidence, and lift measures has been show in column forth to sixth.
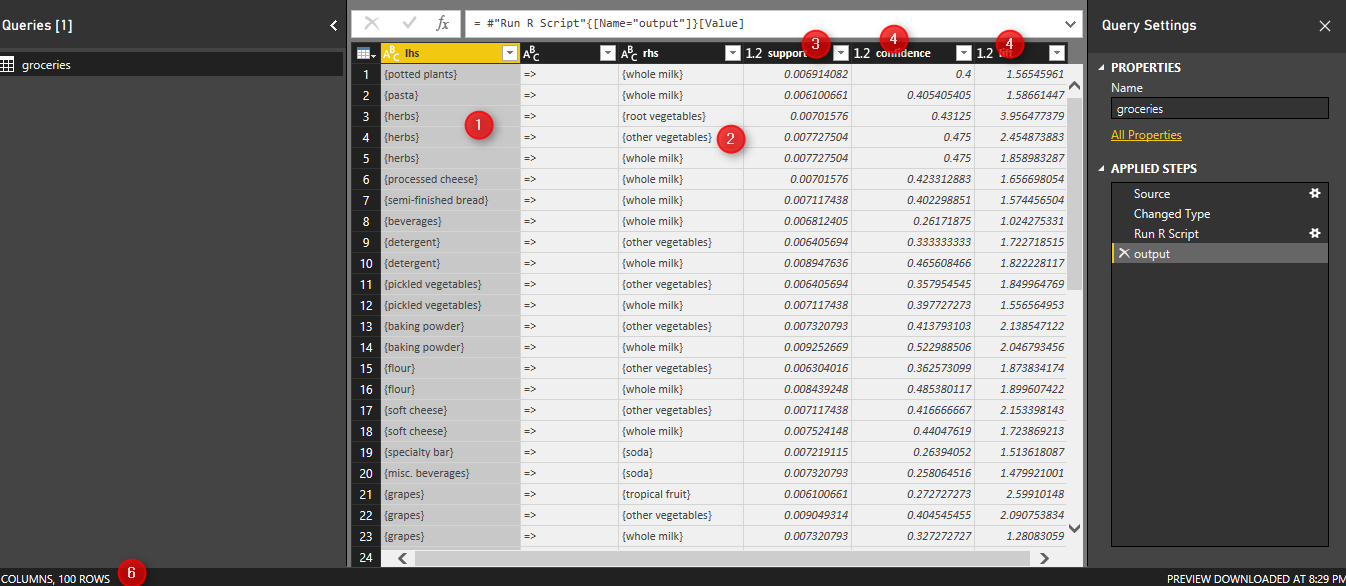
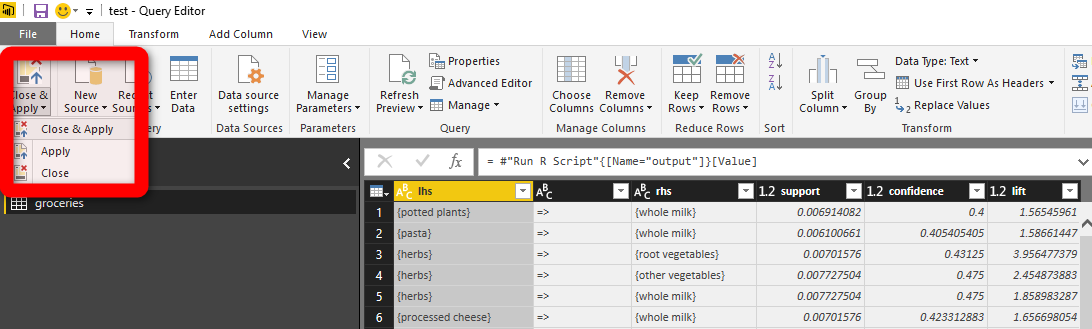
totally 100 rules has been shown (number 6). finally click on close and apply in top left side (see below picture)
now we can create a visualization for showing item and related items in Power BI visualization part.
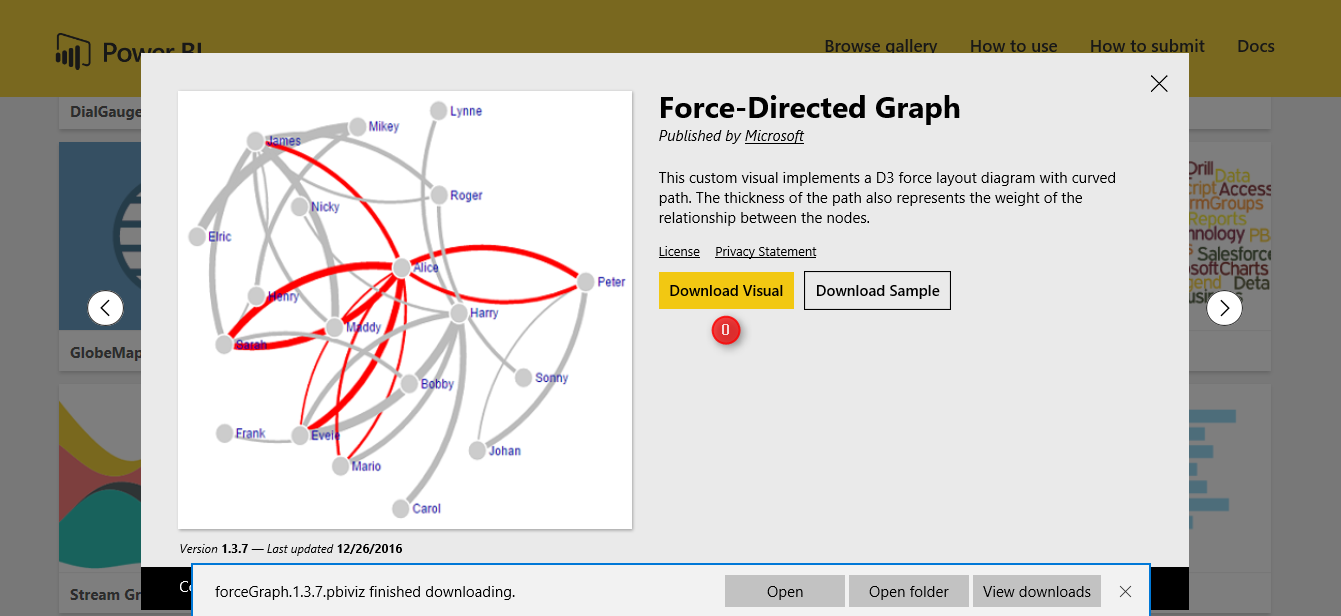
I have used the custom visualization from power BI website name as “Forced-Directed Graph” to show the relationships.
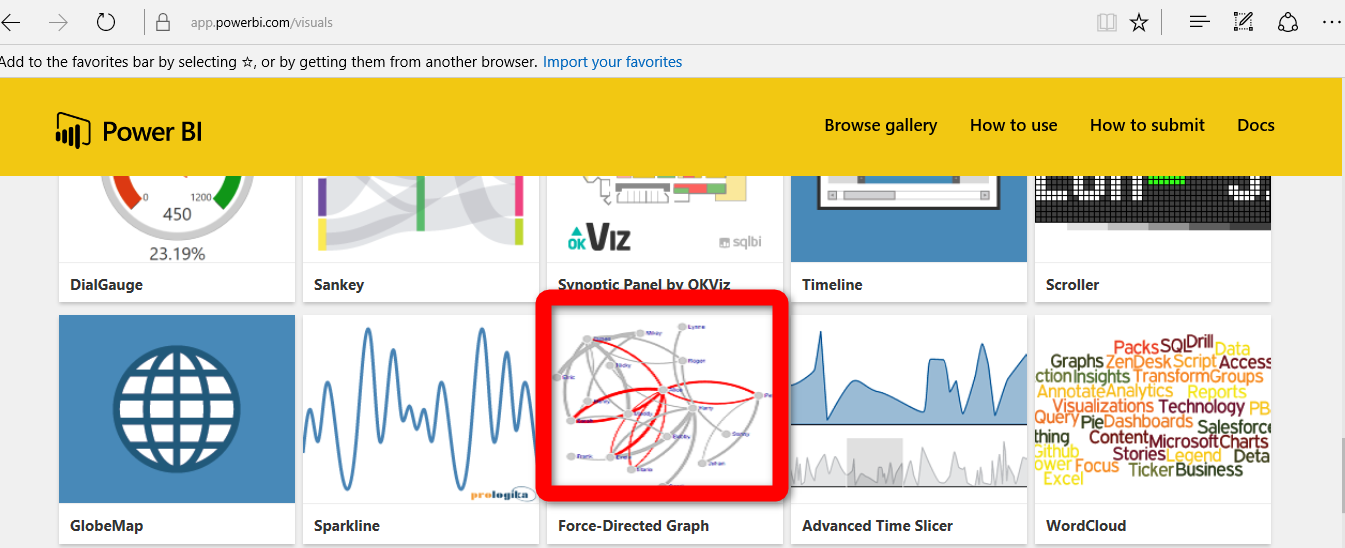
just click on the visualization and download it.
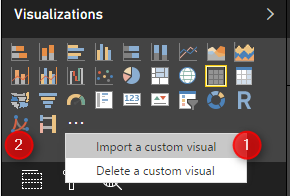
after downloading it, then import it to visualization part. first click on the 3 dots and select the “Import a customer visual” and import the downloaded one.
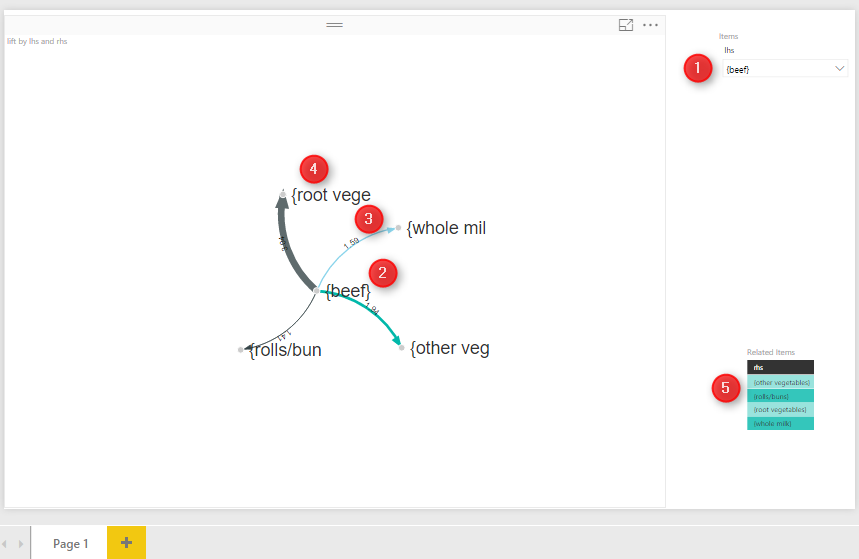
then in visualization first click on the right side and visualization part on the “Forced-Direct” chart (number 1) then in the right side in “Source” (number 3,4,5) bring the lhs, rhs and lift. this char shows the lhs (main items) as main node, the rhs ( the related items in shopping basket) as the related nodes. the thickness of the line between the nodes, show the lift value. the bigger value for lift the thicker line. and the product is much more importance. I had also a drop down list to items.
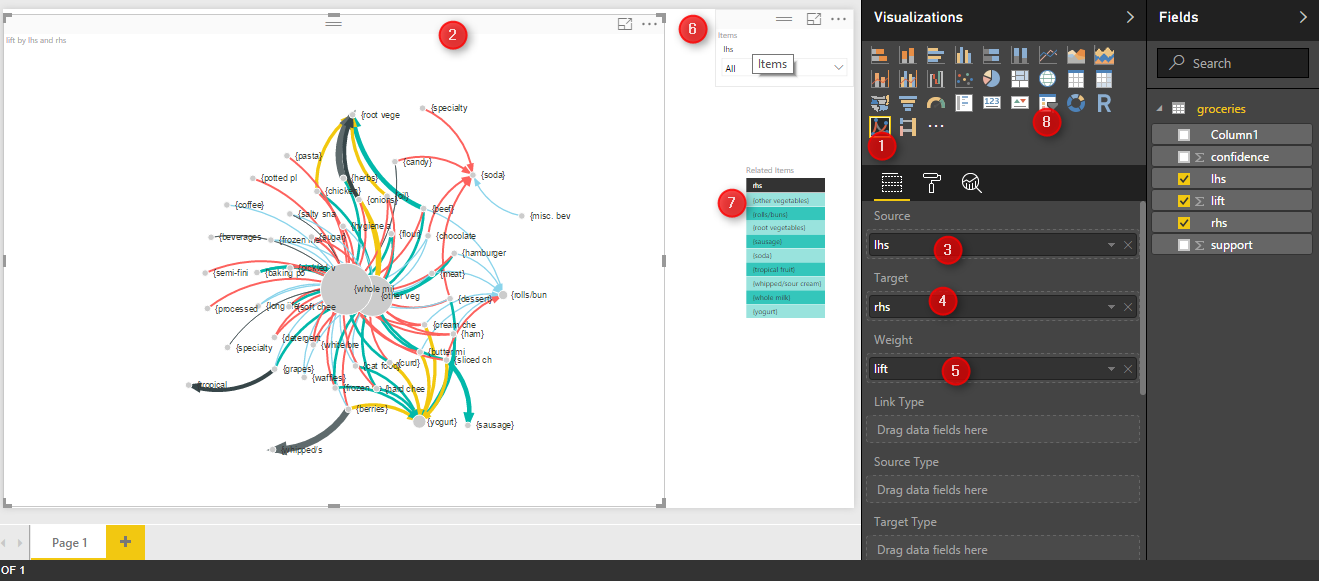
so by selecting for example “beef” from drop down the graphs show the related items to beefs. such as “root vege, whole mil, rolls, and Veg. the importance and possibility of purchasing these items has been shown by the thickness of the line so in this example “Root Veg” is main rules and has much more importance than the others.
there are some other useful visualization that can be used for showing the customer shopping behavior .
[1] Machine Learning with R,Brett Lantz, Packt Publishing,2015


library(Matrix)
library(arules)
groceries <- read.transactions("C://Users//joe//Documents//arules//groceries.csv", sep=",")
Temp<-apriori(groceries, parameter = list(support = 0.006, confidence = 0.25, minlen = 2))
output<-inspect(Temp[1:100])
I have error:
ErrorCode=-2147467259
ExceptionType=Microsoft.PowerBI.Radio.RScriptRuntimeException
Could you please send the entire error code So I can follow it up?
The Tool cannot work with large data, need to be re-checked.
Thanks Muhammad, yes ther is some limitation on this, will post an advance one soon