
Measure tables in Power BI models are a fantastic way to group your calculated measures together in one place and make for a tidy model.
Unlike calculated columns, a calculated measure can be placed on any table so long as the best practice of using the table name for every column reference.
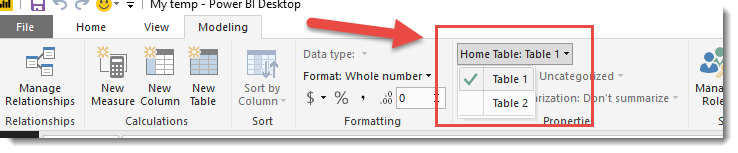
Power BI desktop even provides a handy feature to allow you to move your measure to a different table if you like. As you can see from the image below, you can highlight your measure in the field list and using the Home Table option on the Modelling tab, you can move your measure around, ideally in a way to make it easier for users of your model.
I certainly like grouping my measures into a single table, or logical groups to save time searching and scrolling.
But……..
Something you need to be aware of when doing this, you are going to make it harder for features in the Web Service including Q&A and Quick Insights to work as you might expect once you publish your report.
A Microsoft insider has confirmed that Q&A handles ambiguity by measuring the distance between objects in the model. If you ask “count orders by city”, this could be interpreted as “count orders by the city of the customer of the order” or “count orders by the city of the manufacturer of the product of the order”. The second interpretation is less likely due to the increased distance.
By placing measures in a single table and not where they may naturally sit, you’re undermining the heuristic. So if you ask, “net sales by city”, Power BI can’t tell if that net sales is closely related to orders, so there is no way to know that “customer city” is a better choice than “manufacturer city”. A guess is made and is not always correct. Quick insights also appears to struggle with measures placed on a measure table.
There is talk of updating the way the Power BI engine handles the Display Table and the Definition Table(s) but until then, just be aware of this potential trip.
A big thanks to my good friend Matt Allington for helping spot fascinating insight.


Good to know, Phil. Thanks. Aside: I know Ken Puls isn’t a fan of having a measures table, but I can’t recall why. Maybe he’ll swing by and elaborate.
Ken informs me that he tends to hide all non-measure fields in a fact table, and given they are much easier for an end user to find, he doesn’t bother using the extra steps to create a measure table…he just has all measures classified under the original table names.
Good to know different perspectives on this stuff.