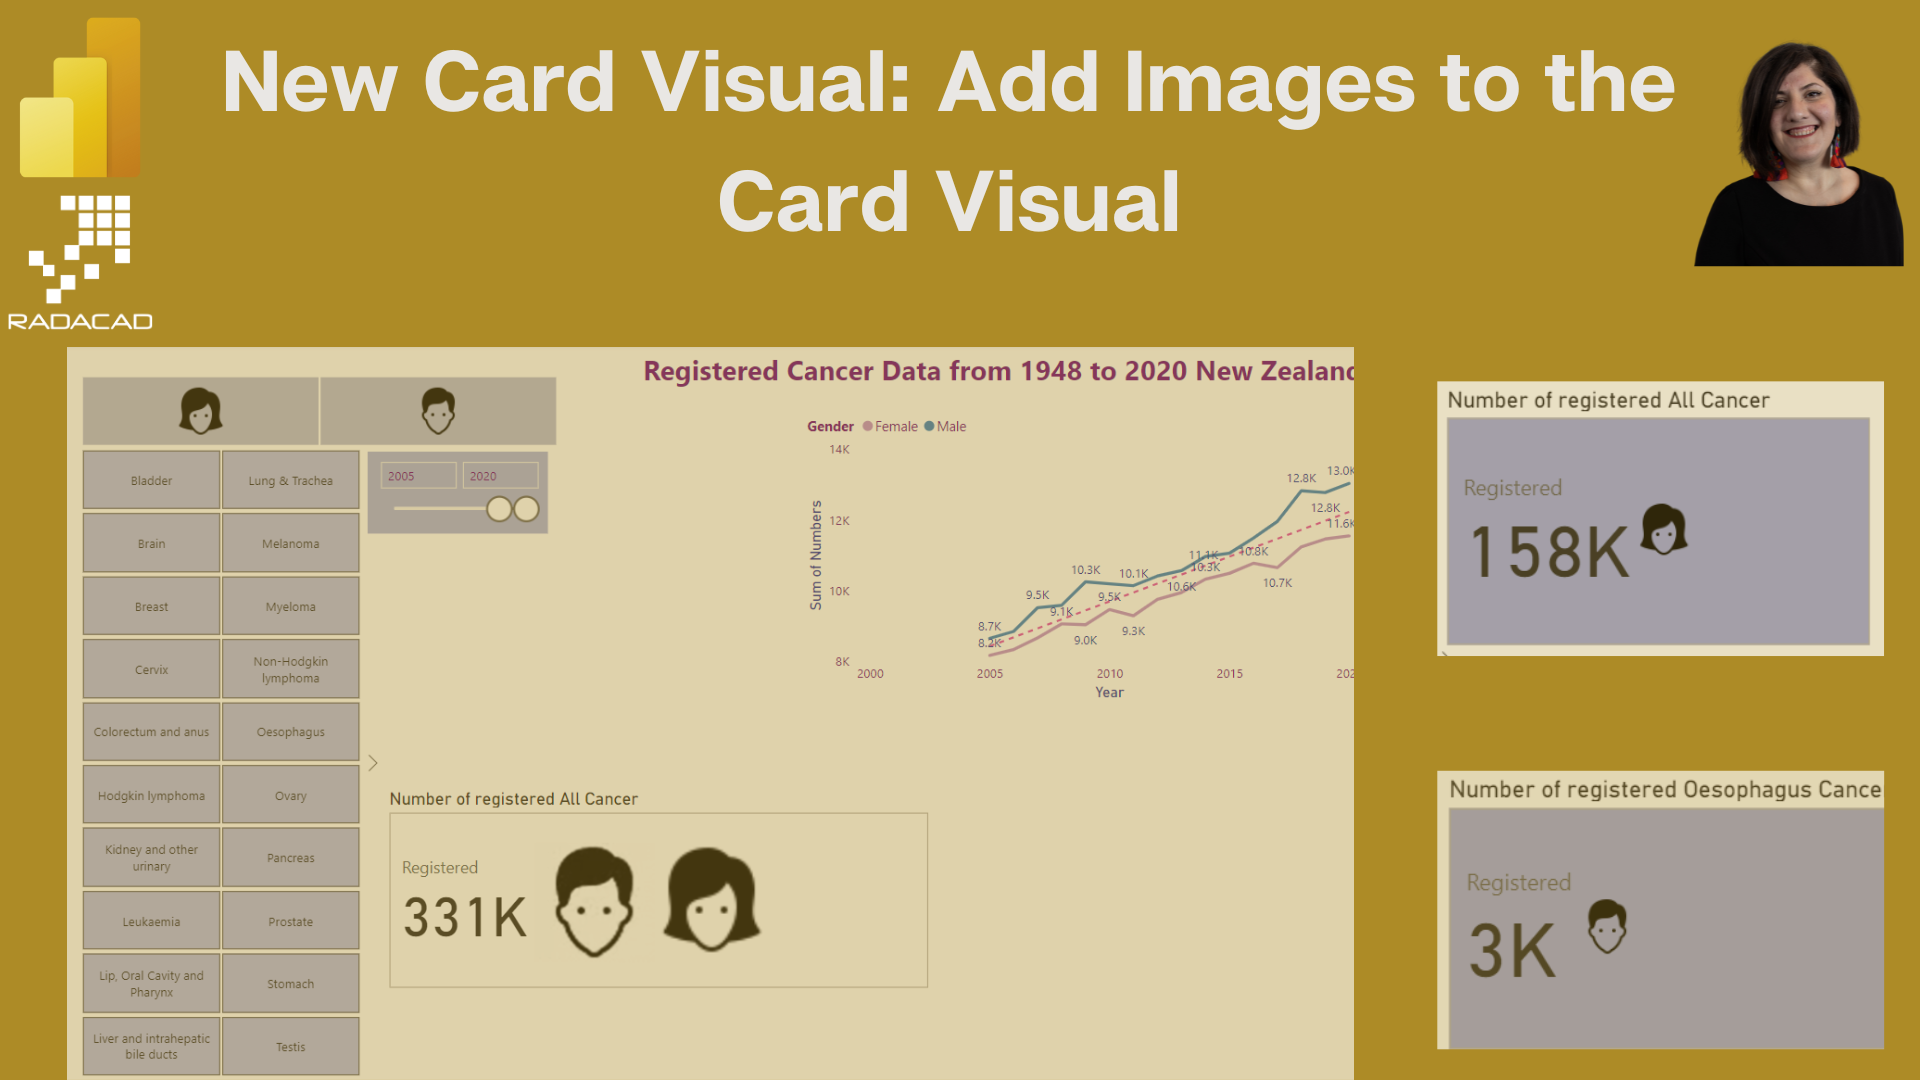
One of the interesting features of the New Card visual is the capability to add images to the Card visual.
It added more context to the car visual.
In this blog post, I will show some data related to cancer in New Zealand based on gender and cancer type.
Now I made two changes
first if I selected the Female in the above slicer, the female icon also appears on the car visual!!
New Card visual provides this feature for me
Note: Make sure you have access to the latest Power BI version (June 2023) from Here
I already have a link to the images in my data set below
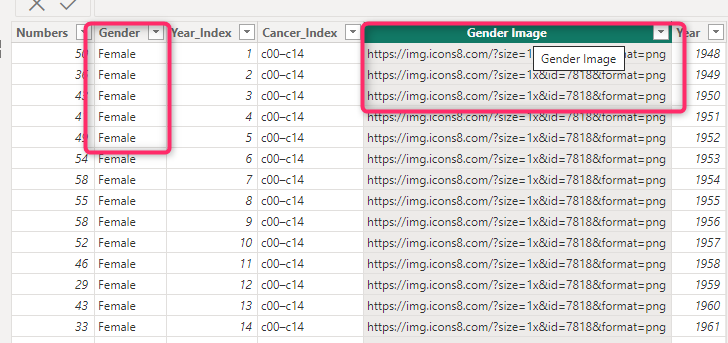
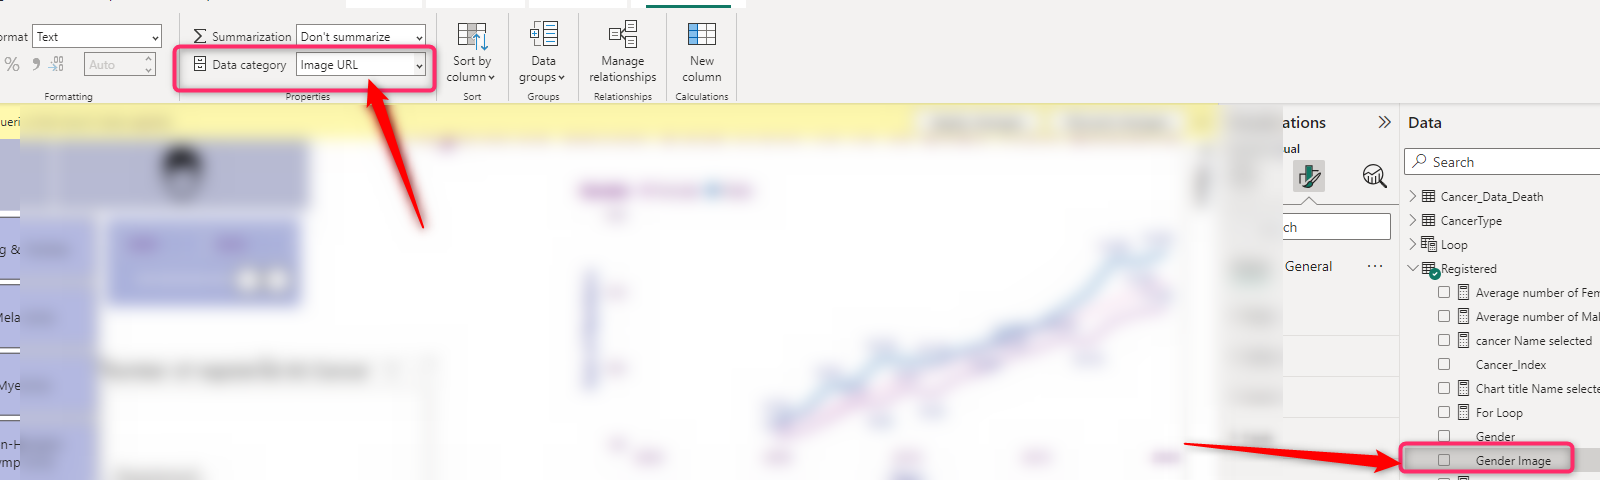
to ensure there is a need for a URL, and you already defined them in your original dataset. Also, in the report tab, check the image field; the data category is set to be Image URL as below.
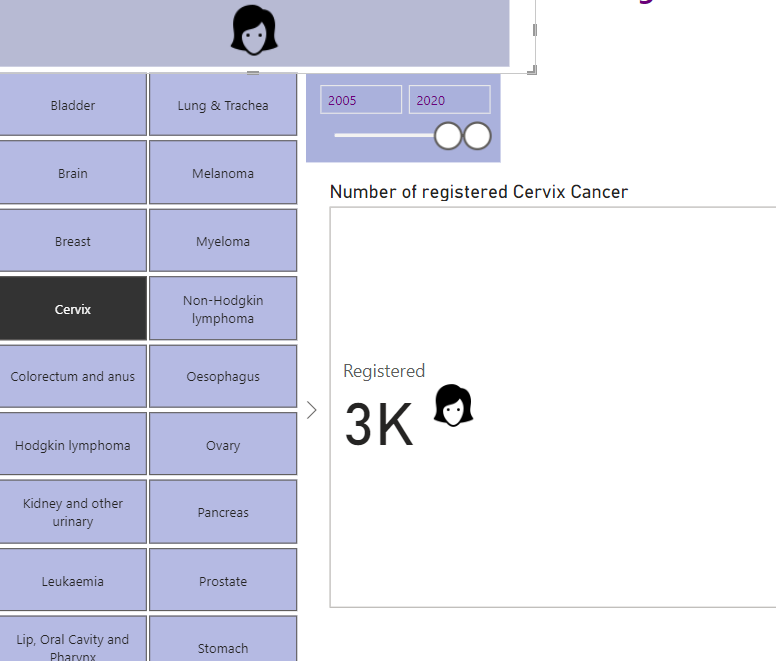
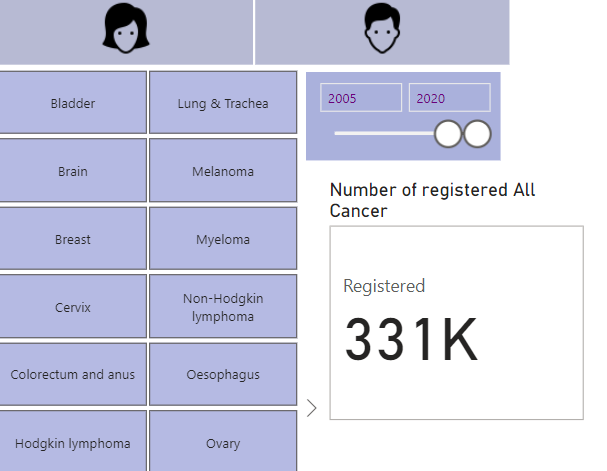
I have a card visual that shows the number of registered cancer data for selected cancer from slicer.
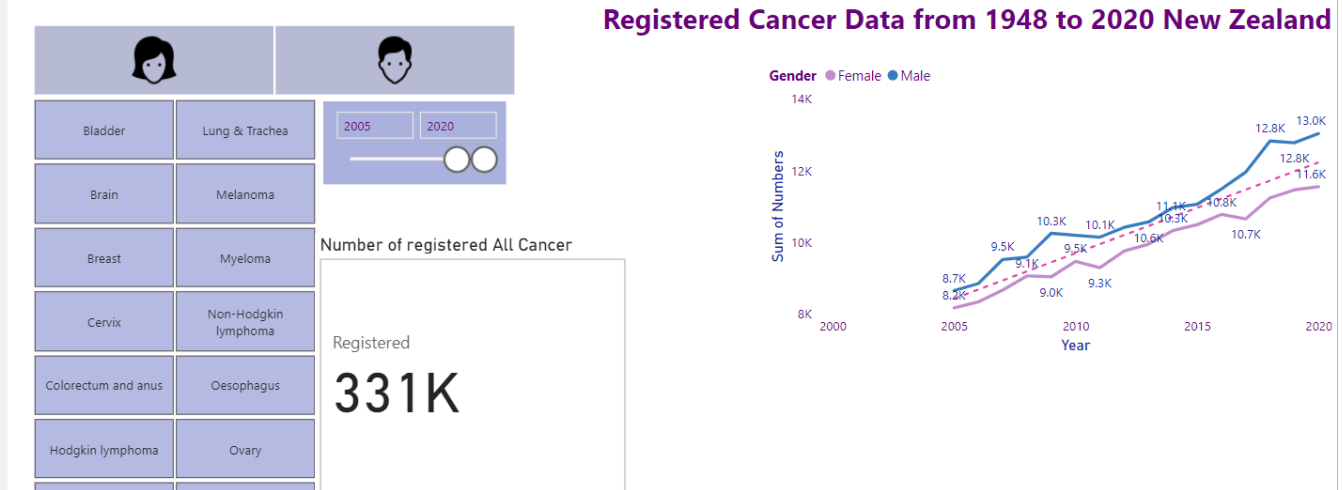
When there is no selection, the card visual shows all cancer for all gender as below
I am going to create a measure that shows the image of the selected gender. the code is so easy as below
Slicer Images = SELECTEDVALUE(Registered[Gender Image],"https://radacad.com/wp-content/uploads/2023/06/2023-06-23_15h35_02.png")
Selectedvalue function helps me to select the image URL, based on the selected gender, if the gender is not selected, I will show an image that contains the pics of males and females as below

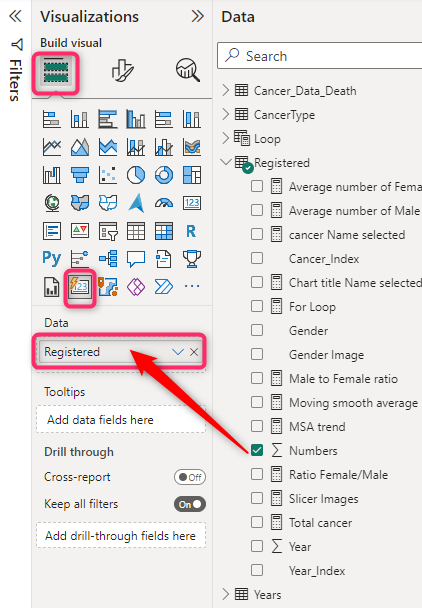
Now I need to change some settings on the format of the Card’s visual
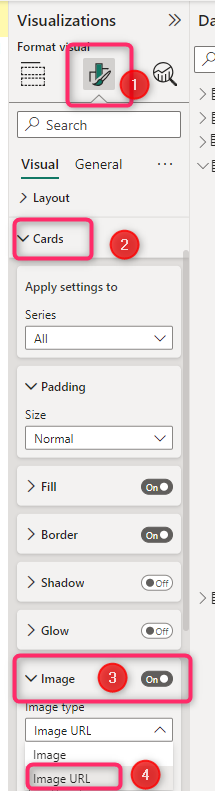
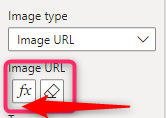
under the format tab, under Card, select Image and then choose the Image URL type
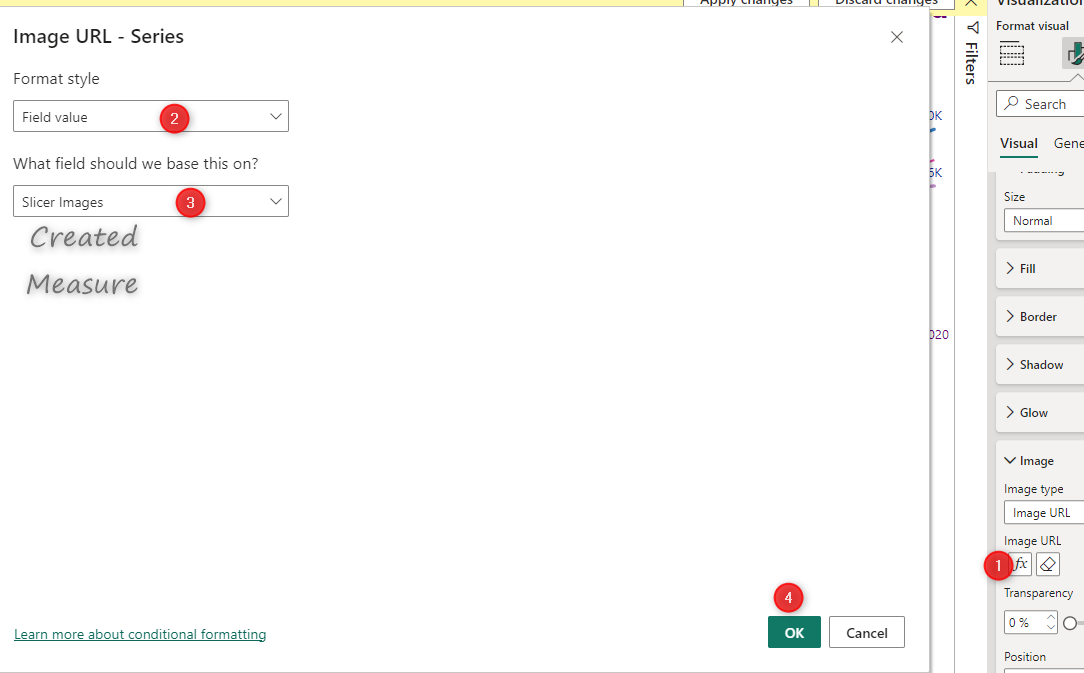
Use the conditional formatting to assign the created measure to the Image URL
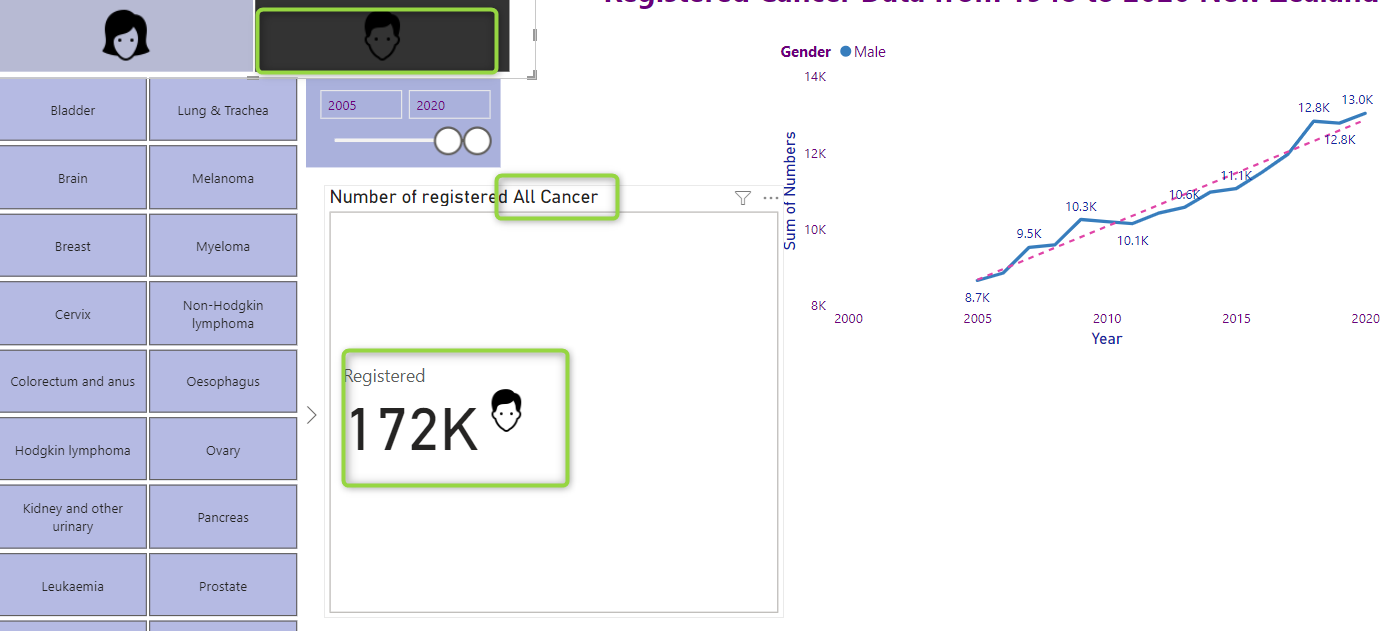
Now, if no gender is selected, the car visual shows an image of both male and female. whilst, if I select Female or Male , the card visual shows relatively.
For all men and all type of cancers
For all women who had Cervix cancer