
In previous posts, I have explained some basic concepts of time series. In the first post I have explained the basic concepts of time series, and in second and third posts I have explained: “Exponential Smoothing” for forecasting data without trend, and with the trend. In the last post, I have explained how we can show different components of a time series: trend, seasonality, and irregular component in one picture. In this post, I am going to show how we can do exponential smoothing using power BI custom Visual. In office store in Power BI section search for “time series”:  In the above picture, we have 2 main charts for forecasting: one used “Exponential Smoothing” approach (number 2), the other one used the “Arima” approach. (number 3). I already talked about how exponential smoothing work in the post 2 and 3. I am going to import this custom visual into power BI website as below from “Power BI store” see below:
 So first click on the 3 dots, and choose the from store option to import custom visual directly from Power BI, then the below page will show up, in the search area type “time series” (number 1), then choose “time series forecasting chart” the first option is “exponential smoothing” (I have to explain this algorithm in part 3 and part 2).
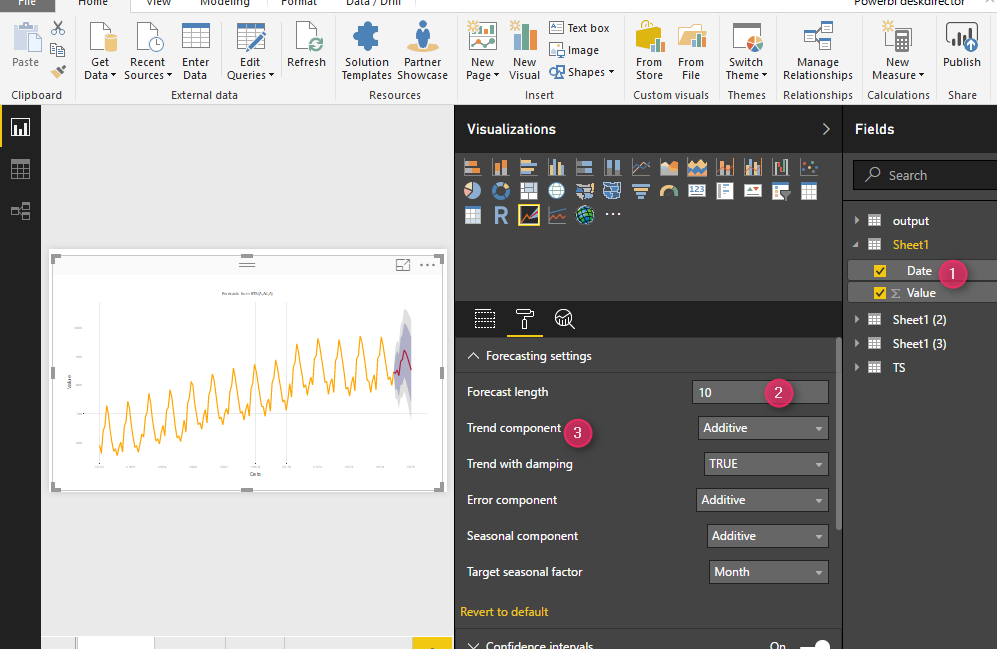
 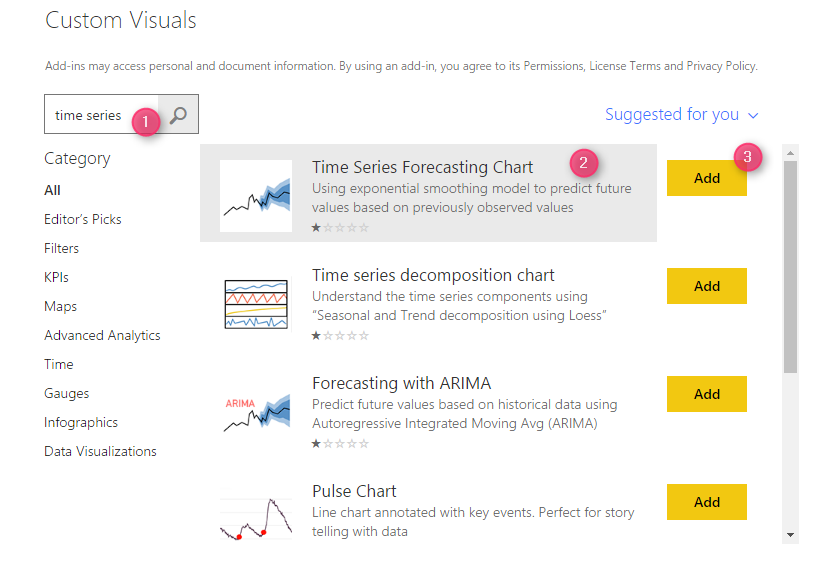 as you can see in the above picture, I am going to import data into Power BI. Then, I am going to choose two fileds, as Date and Value into chart. As you can see in the below picture (number 1), I am going to explain the parameters that we have to set up in the below picture. The first paramter that we have to set up is “forecasting settings”
Forecasting lenght
The first parameter has been used for identify the number of period that we want to forecast. For instance, if we have data for each month. I put 10 for forecasting lenght, means that we want to forecast for up to 10 months.
Trend Component
The trend component can be “Additive” or “multiplicative “, So what is difference?
Additive Model
In additive model, we have four main components: (to see wether your data has trend and seasonal data check the decompose component that I have explained in the last post)
![]()
So in an additive model we may have seasonal behaviour, we may see an increasing or decreasing trend, also there is a possible to see a cyclical behaviour (I will explain it later), and see the irregular component (residual or error).
Imagin, we have a sales price for our products. the difference of sale’s price in July and January is constant in each year, however there is a possibility that this difference change year by year so we have “Muitiplicative Model”.
Multiplicative Model
In additive model we have
![]()
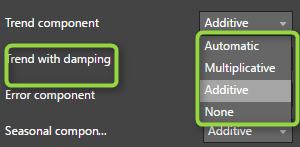
In Power BI, we have 4 main options: Additive, Multiplicative, None, and Automatic.
so if there is no trend component we can choose “None” or if we not sure we can choose “Automatic”.
In next post, I am going to explain the other features and parameters and how to set them up.
[1]http://www-ist.massey.ac.nz/dstirlin/CAST/CAST/Hmultiplicative/multiplicative1.html


