
Among all the functions in DAX; the behavior of ALL function still seems mysterious for many. Many people, don’t use it at all and end up writing a very complicated calculation for a scenario that only one simple expression can do the same job. Some people, use it, but don’t exactly know how the function works, and get some unexpected results, and call it an error. In this article, I’m going to explain what ALL function is, how it can be used, and what are use cases of using such a function in DAX and Power BI. If you like to learn more about Power BI, read the Power BI book from Rookie to Rock Star.
Prerequisite
The dataset for this model is the AdventureWorksDW2012 Excel file, which you can download from here. Tables used in this example, are DimCustomer, DimProduct, FactInternetSales.

What is the ALL() Function in DAX?
To understand the behavior of ALL function, nothing is better than an example, let’s see how it works in action; I’ve created a Measure using ALL function. ALL function accepts a table as input, and
ALL( <table name or column name>, [Column name 1],[column name 2], …)

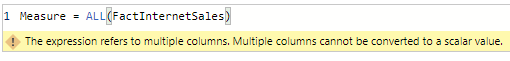
The output of ALL function is a TABLE, and you cannot use it in a measure. as you can see in below screenshot; if I create a measure with ALL, then I get an error saying; The expression refers to multiple columns. Multiple columns cannot be converted to a scalar value.
As the output of ALL function is a table, then you have only two ways to use it in DAX:
Using ALL directly in Calculated Table
As the output of ALL function is a table, then it can be used directly in creating a calculated table. For example, All used with a table name will be an exact copy of that table.

Or, if you use all with only one or more columns, then you get a table with a distinct combination of those column values;


Using ALL function in the Calculated table, give us one of the most common use cases for ALL function:
Role Playing Dimension using ALL and Calculated Tables
You can create role-playing dimensions, which are copies of an existing dimension (such as Date dimension). I have written about this scenario in my article here.

Using ALL as an Input for Other DAX functions
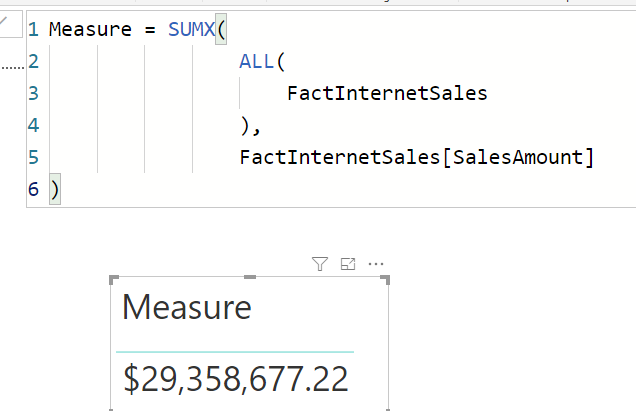
If ALL cannot be used directly in a Measure, then no dramas. It can be used as an input parameter for other functions. In DAX, there are many functions which accept a table as input. All those functions can accept ALL as their input parameters. For example, SUMX is a function that one of its parameters is a table; in our case; this can be a table generated by ALL as a function.

As an example, this is one sample usage of ALL and SUMX:
Measure = SUMX(
                ALL(
                    FactInternetSales
                ),
                FactInternetSales[SalesAmount]
)
SUMX is just one of the DAX functions, that accepts a table as an input parameter. there are many other functions such as Calculate and many other functions in the same category. Combination of ALL with other functions and using that in DAX measures are the most common methods of using this function. but before going further, let’s explain something very important about ALL function.
ALL Ignores the Filter
In addition to returning a table as the output, ALL will also ignore any filter(s) applied on it. What does that mean? it means if you have a visualization which is filtered by something, then ALL won’t care! It will just act like there is no filter there. Here is an example:
Total Margin = SUMX(
ALL(FactInternetSales),
FactInternetSales[SalesAmount]-FactInternetSales[TotalProductCost]
)

Sum of Margin expression is as below:
Total Margin = SUMX(
FactInternetSales,
FactInternetSales[SalesAmount]-FactInternetSales[TotalProductCost]
)
and Total Margin expression is as below:
Total Margin = SUMX(
ALL(FactInternetSales),
FactInternetSales[SalesAmount]-FactInternetSales[TotalProductCost]
)
As you can see, the only difference is the usage of ALL in the Total Margin expression. The output value is also different. The total Margin in each row is exactly the same value; $12,080,883.65 like the margin is never filtered by Education, or let’s say like ALL function ignores the filter applied.

Common Use Case for ALL: Calculating Percentage
One of the most common use cases for using ALL is calculating the percentage of a measure. The trick is to do the calculation of that measure once without ALL, and once with ALL, and then divide one by the other! Now just for an instant, think how would you do this calculation if there was no ALL function? how would you find out the total margin, when the margin is already filtered by Education category? This is the power of ALL as a function to give you such a combination.

ALL and Calculate
ALL can be also used as an input for the Calculate function. The second input of the calculate function is a filter, and a table function acts as a filter, in our case, ALL is a filter function, that actually DOES NOT filter! No matter, where do you write your calculate function, whatever filter applied, will be ignored when you put an ALL function in it.

Use Case for ALL function: Controlling the Interaction
I have written previously about a method in DAX that you can control the interaction between visuals. Let’s say with the selection of an item in the slicer, you don’t want the values in a specific measure in table visual to change. Well, now that you know about ALL; it seems possible how to do it.
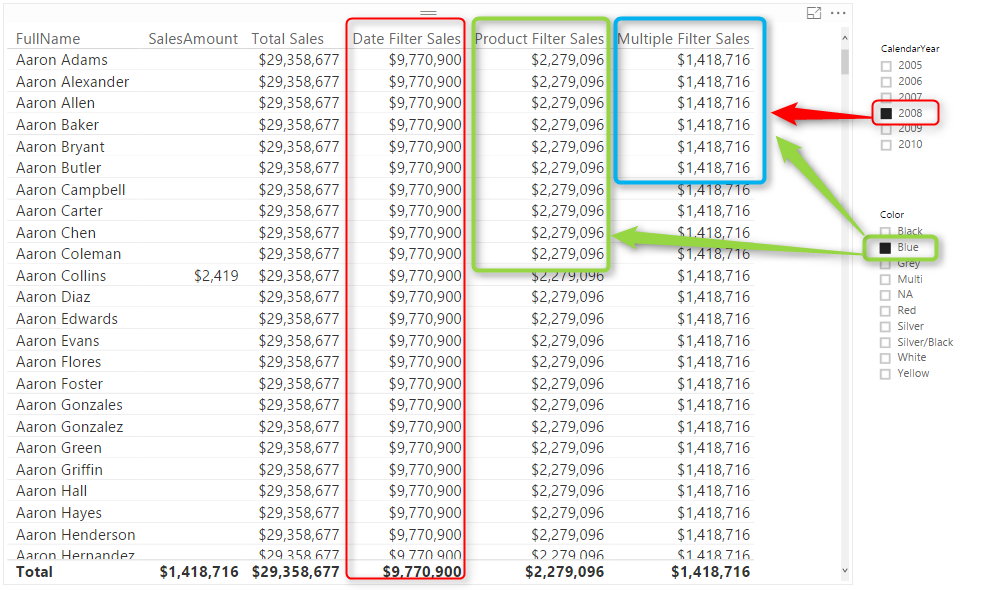
As you can see in the above screenshot, the Date Filter Sales is only impacted by CalendarYear Slicer, and the Product Filter Sales is only impacted by the Color Slicer, however, the Multiple Filter Sales measure is impacted by both!
| Measure | Slicer |
| Date Filter Sales | Date |
| Product Filter Sales | Product |
| Multiple Filter Sales | Date and Product |
Here is the script for the Date Filter Sales Measure for example:
Date Filter Sales = CALCULATE( SUM(FactInternetSales[SalesAmount]),
	DATESBETWEEN(DimDate[FullDateAlternateKey],
		FIRSTDATE(DimDate[FullDateAlternateKey]),
		LASTDATE(DimDate[FullDateAlternateKey])
	),
	ALL(FactInternetSales)
)
As you can see, an ALL function been used, however, because there is another filter in Calculate (DatesBetween), the expression is now going to consider the intersection between these two filters. As a result, in this case, ALL will ignores any filters coming from any other tables except the DimDate. To read more about examples like that, read my article here.
The Table which ALL is applied to is Important
It is not just important to use the ALL function, it is also important to use it on the right table needed. For example, if I want the Total Sales regardless of any filters, I can write:
Total Sales = CALCULATE(
    SUM(FactInternetSales[SalesAmount]),
                ALL(
                    FactInternetSales
                )
)
However, if I am interested to achieve the total sales of all customers, but then allow all other filters to pass, I can write:
Total Sales Customer = CALCULATE(
    SUM(FactInternetSales[SalesAmount]),
                ALL(
                    DimCustomer
                )
)
In the second expression, I used ALL(DimCustomer), and in the first one, I used ALL(FactInternetSales). It means that the first expression will ignore ANY filters. However, the second expression only ignores filters coming from the DimCustomer.

The ALLExcept Function: An Extension
Sometimes you want to ignore the filter coming from all columns in the table, except for one or more columns. Using ALLExcept is a good option for such scenarios. Let’s say that We want the filter from Gender to pass through, but the filter from all other columns to be ignored. We can write an expression using ALLExcept, and use the Gender in it as below;
Total Sales Except Gender = CALCULATE(
    SUM(FactInternetSales[SalesAmount]),
                ALLEXCEPT(
                    DimCustomer, DimCustomer[Gender]
                )
)

Summary
Because the functionality of ALL seems like magic, so I titled this article as; Now you see me! use cases of all function in DAX and Power BI. ALL function, despite the fact that looks basic and elementary, it is one of the most important and commonly used functions in DAX. the main functionality of ALL is to ignore filters coming from one table. You can use the ALL function inside other functions as the table input, and there are many examples such as percentage calculation, and overwriting the interactions of measures that can be done simply using ALL function. If you haven’t used this function before, consider it from now on seriously. and if you have used it, put some of your use case scenarios in the comment below to share with other readers.


Reza is author of more than 14 books on Microsoft Business Intelligence, most of these books are published under Power BI category. Among these are books such as Power BI DAX Simplified, Pro Power BI Architecture, Power BI from Rookie to Rock Star, Power Query books series, Row-Level Security in Power BI and etc.
He is an International Speaker in Microsoft Ignite, Microsoft Business Applications Summit, Data Insight Summit, PASS Summit, SQL Saturday and SQL user groups. And He is a Microsoft Certified Trainer.
Reza’s passion is to help you find the best data solution, he is Data enthusiast.
His articles on different aspects of technologies, especially on MS BI, can be found on his blog: https://radacad.com/blog.
Hi Reza,
Great article as usual.
All the filtering examples you use show the filters on a whole table being ignored, but it’s possible of course to ignore the filters on a certain column of a table but allow all other filters through.
You give the ALLEXCEPT example
ALLEXCEPT(DimCustomer,DimCustomer[Gender])
Which ignores all filters on the DimCustomer table except for the one on Gender column
But I think it’s worth pointing out that you can also do the opposite – ignore the filters ONLY on the Gender column while allowing all other filters on the DimCustomer table through with
ALL(DimCustomer[Gender])
Cheers
Mike
Hi Mike.
Thanks
Correct. I did not mention using ALL with columns only, as it is also have a side effect because it will generate the output which is a unique list of values of that column or columns, the output behavior might be different. I saved that for another post later 🙂
Cheers
Reza
Hi ,
verry usefull tuto . but we had a verry small problem . we can’t download excel file .
think you , you are the best
the link is OneDrive link, it might be filtered in your network. try a different network.
Hi Reza,
What a simplistic way of putting things across, with better to understand examples and annotations.
Thank you so much…
Deepak
Thank you for these explanations.
I’m catching up with updates as I read this and noticed “We’ve also extended the All function so that using the All function without arguments will clear all filters in the filter context.” https://powerbi.microsoft.com/en-us/blog/power-bi-desktop-march-2019-feature-summary/#DAX
Hi Mary
Yes, in the March 2019 update of Power BI, you can now use ALL function with no parameters (not even the table name), and that means no filtering across any of tables in the model.
I will add that into this post shortly.
Here is an example of that:
Measure = CALCULATE(

    SUM(FactInternetSales[SalesAmount]),

    ALL()

)
Cheers
Reza
I thought you were gonna describe use cases for ALL DAX functions LOL. I misread the title.
But still, the article is very good. I was not disappointed.
That Would have been books to explain ?
Thanks Andre
Excellent. Keep posting :).