
I have written a blog post while ago about using Edit Interaction to control the interaction of visuals. There are however sometimes that you want to have some of filters to be applied on (some measures) of a single visual, but others not. In this post I’ll explain one method of writing DAX expressions in a way that overwrite the way that Power BI visuals interact. You will learn how to write a DAX expression that some filters affect on that, some not. Let’s see how the method works. If you want to learn more about Power BI; read Power BI online book from Rookie to Rock Star.
Prerequisite
For running example of this post you will need AdventureWorksDW sample database, or you can download Excel version of it from here:
Filter Context in DAX
It is impossible to start explaining this method without talking about filter context. Filter context is everything you used for filtering and slicing and dicing in the report. As an example; create a Power BI model based on DimDate, DimCustomer, DimProduct, and FactInternetSales. Make sure that you have only one active relationship between FactInternetSales (OrderDateKey) and DimDate (DateKey). Create a Measure with DAX code below:
Sum of Sales Amount = SUM(FactInternetSales[SalesAmount])
Now Create a report with a Table of Full Name (from DimCustomer), Sum of Sales Amount. also create two slicers; one for Calendar Year, and another for Product Color.
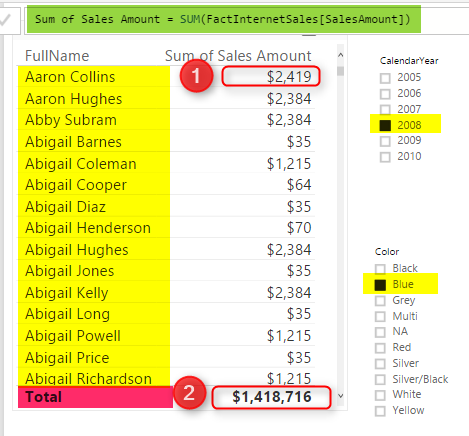
In above screenshot you can see that result of Sum of Sales Amount is not always same value. IT DEPENDS! Depends on what filter you have selected, or what values you have sliced and diced based on. For example Highlight numbered 1, shows sum of Sales Amount for product Color Blue, Calendar Year 2008, and Customer Full Name “Aaron Collins”. While the highlight numbered 2, shows sum of Sales Amount for Year 2008, and color Blue, but for all Customers. What you see here is Filter Context.
Filter Context is all filters, slicers, highlight, and slicing and dicing applied to a report or visual. Filter Context for number 1 in above image is: product Color Blue, Calendar Year 2008, and Customer Full Name “Aaron Collins”.
Everything in DAX resolves based on Filter Context and Row Context. However there are some ways to control the context. Controlling the context means controlling interaction of visuals. In above example, with any change in the slicer, filter context changes, and result of Sum(SalesAmount) also changes. However if we write a DAX expression that doesn’t change with selecting a slicer, that means we have controlled the context. Let’s look at some examples.
Total Sales Regardless of Filters
As an example; you can create a measure that returns total sales amount regardless of what is selected in slicers or filters, regardless of what the filter context is. For this you can use either Iterators (SumX, MinX, MaxX,….) or Calculate function. Create measure below;
Total Sales = SUMX(ALL(FactInternetSales),FactInternetSales[SalesAmount])
In above DAX expression ALL function will act regardless of filter context. No matter what Filter context is ALL will return everything, and as a result SUMX will calculate sum of SalesAmount for all rows. Here is a screenshot of report;
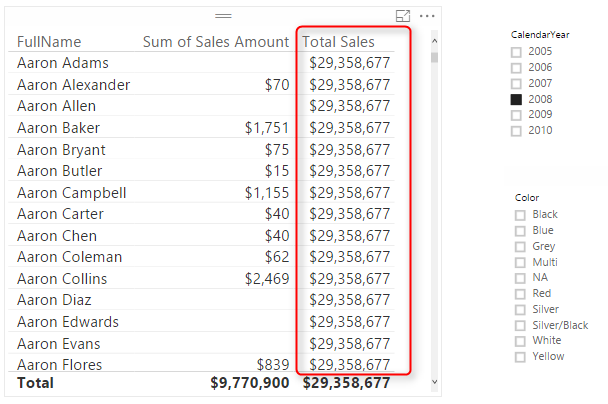
Doesn’t matter what filter you select, or what slicer you click, result for measure is always total value. Now let’s control the context a bit different.
Total Sales Filterable Only by Date Selection
Let’s take one step forward with bringing one selection criteria in the measure. For this measure we want to create a Total Sales that can be only changed when a date selection happens (Year in our example), but nothing else.
Because we need multiple filters now, I’ll do it this time with CALCUALTE function where I can specify multiple filters. Here is the code:
Date Filter Sales = CALCULATE( SUM(FactInternetSales[SalesAmount]),
	DATESBETWEEN(DimDate[FullDateAlternateKey],
		FIRSTDATE(DimDate[FullDateAlternateKey]),
		LASTDATE(DimDate[FullDateAlternateKey])
	),
	ALL(FactInternetSales)
)
In measure above we have two filters; ALL(FactInternetSales), and DatesBetween(). DatesBetween brings everything from the FirstDate to the LastDate. FirstDate and LastDate will be depends on the date selection in slicer. as a result DatesBetween will return the filter context of date selection, however everything else will be ignored by ALL(FactInternetSales). Result will be a filter which is junction of these two filter. Here is the result;
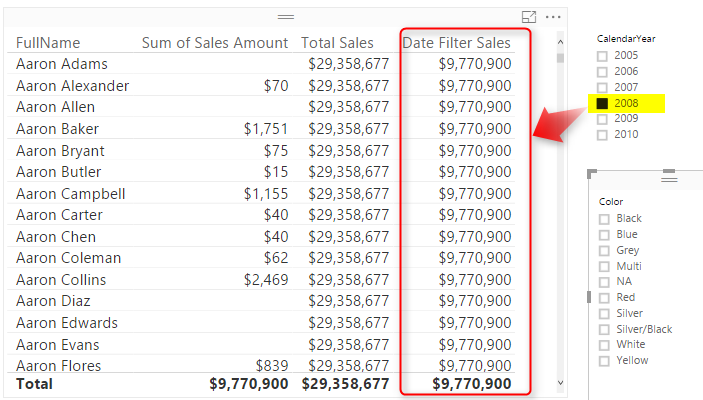
You can see that the value in this new measure (Date Filter Sales) changes by any selection in Calendar Year slicer, but nothing else. Result of this measure will be always sum of sales amount for all transactions in the selected year. If nothing is selected in Year slicer, then this column’s value will be similar to Total Sales Measure.
How if we want to enable multiple filters then? let’s look at another measure.
Measure Filterable with Multiple Selections
Let’s go even one step further and add a measure that can be only affected by selecting values in date and product slicer, but nothing else. You know the answer already I believe. You just need to add one more filter to the list of filters. I’ll do it this time with a RelatedTable function, but you can do it with other methods as well. Here is the new measure;
Multiple Filter Sales = CALCULATE( SUM(FactInternetSales[SalesAmount]),
	ALL(FactInternetSales),
	RELATEDTABLE(DimProduct),
	DATESBETWEEN(DimDate[FullDateAlternateKey],FIRSTDATE(DimDate[FullDateAlternateKey]),LASTDATE(DimDate[FullDateAlternateKey]))
)
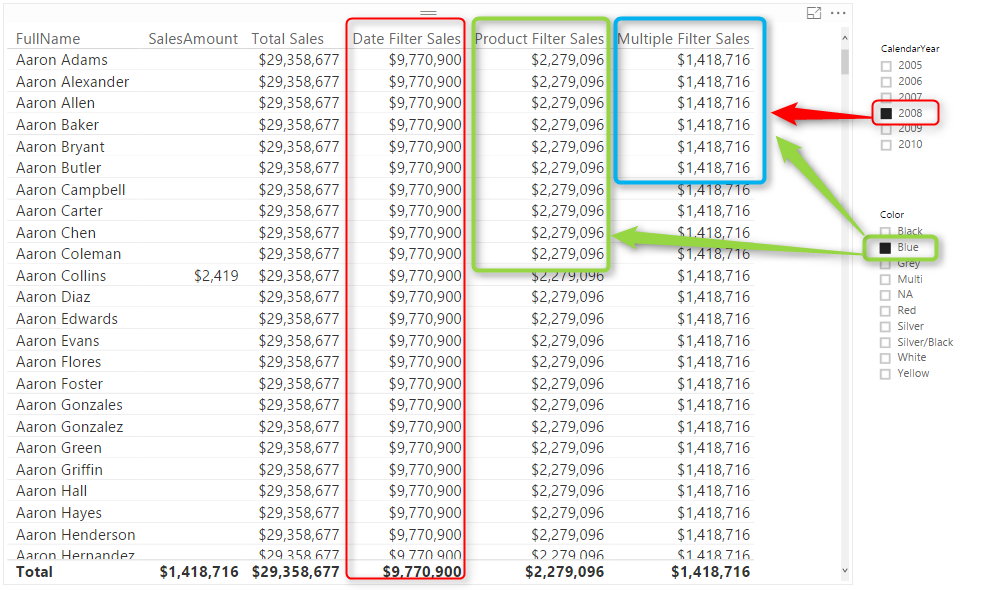
Above measure is similar to the previous measure with only one more filter: RelatedTable(DimProduct). This filter will return only sub set of select products. As a result for this measure Product and Date selection will be effective;
Summary
As you can see simply with DAX expressions you can control the filter context, or in other words you can control the interaction in Power BI. Note that you can write DAX expressions in many different ways, the expression above are not the only way of controlling filter context. Iterators and Calculate function can be very helpful in changing this interaction.
Download
You can download Power BI Demo file from here:
Save
Save
Save
Save
Save


Reza is author of more than 14 books on Microsoft Business Intelligence, most of these books are published under Power BI category. Among these are books such as Power BI DAX Simplified, Pro Power BI Architecture, Power BI from Rookie to Rock Star, Power Query books series, Row-Level Security in Power BI and etc.
He is an International Speaker in Microsoft Ignite, Microsoft Business Applications Summit, Data Insight Summit, PASS Summit, SQL Saturday and SQL user groups. And He is a Microsoft Certified Trainer.
Reza’s passion is to help you find the best data solution, he is Data enthusiast.
His articles on different aspects of technologies, especially on MS BI, can be found on his blog: https://radacad.com/blog.