
Aggregation tables are the fast-performing solution for huge DirectQuery tables in Power BI. In the previous blog post, I explained what aggregation is and why it is an important part of a Power BI implementation. Aggregations are part of the Composite model in Power BI. Your first step for the aggregation set up is creating an aggregated table. In this blog post, I’ll explain how that step can be done. If you want to learn more about Power BI, read the Power BI book, from Rookie to Rock Star.
Video
Sample dataset
If you want to follow the example scenario here, you would need a SQL Server database named AdventureWorksDW. I made some changes in my dataset to be a bit bigger for the size of its fact table, so I can show you the functionality of aggregations. You can download the database link from here:
radacad.com/files/adventureworksdw2012.bak
Sample model
In this sample model, we will be analyzing the data of FactInternetSales (which we assume is our big fact table). Create a Power BI report with the DirectQuery connection to the SQL Server;

With the DirectQuery option, select these tables:
FactInternetSales, DimCustomer, DimDate, DimProduct, DimProductCategory, DimProductSubCategory, DimPromotion, and DimGeography.

Tables loaded into Power BI will have relationships; I just limited the relationship between DimDate and FactInternetSales table to one active relationship based on DateKey (in DimDate) and OrderDateKey (in the FactInternetSales). This is the diagram of relationships.

What is Aggregated Table
The aggregated table is a table in Power BI aggregated by one or more fields from the DirectQuery source table. In our case, the Aggregated table would be grouped by specific fields from the FactInternetSales table. You can use various methods to create the aggregated table. You can create the aggregated table with T-SQL statements from SQL Server. Or you can create it in Power Query. Or you can even do it in DAX using Summarize or GroupBy or other aggregation functions. You can create it in all other data transformation tools and query languages. Since we are doing everything with Power BI here, I’ll create the aggregated table with Power Query.
The aggregated table can be created in the data source with T-SQL queries, or in Power Query, or anywhere else that you can create a grouped table.
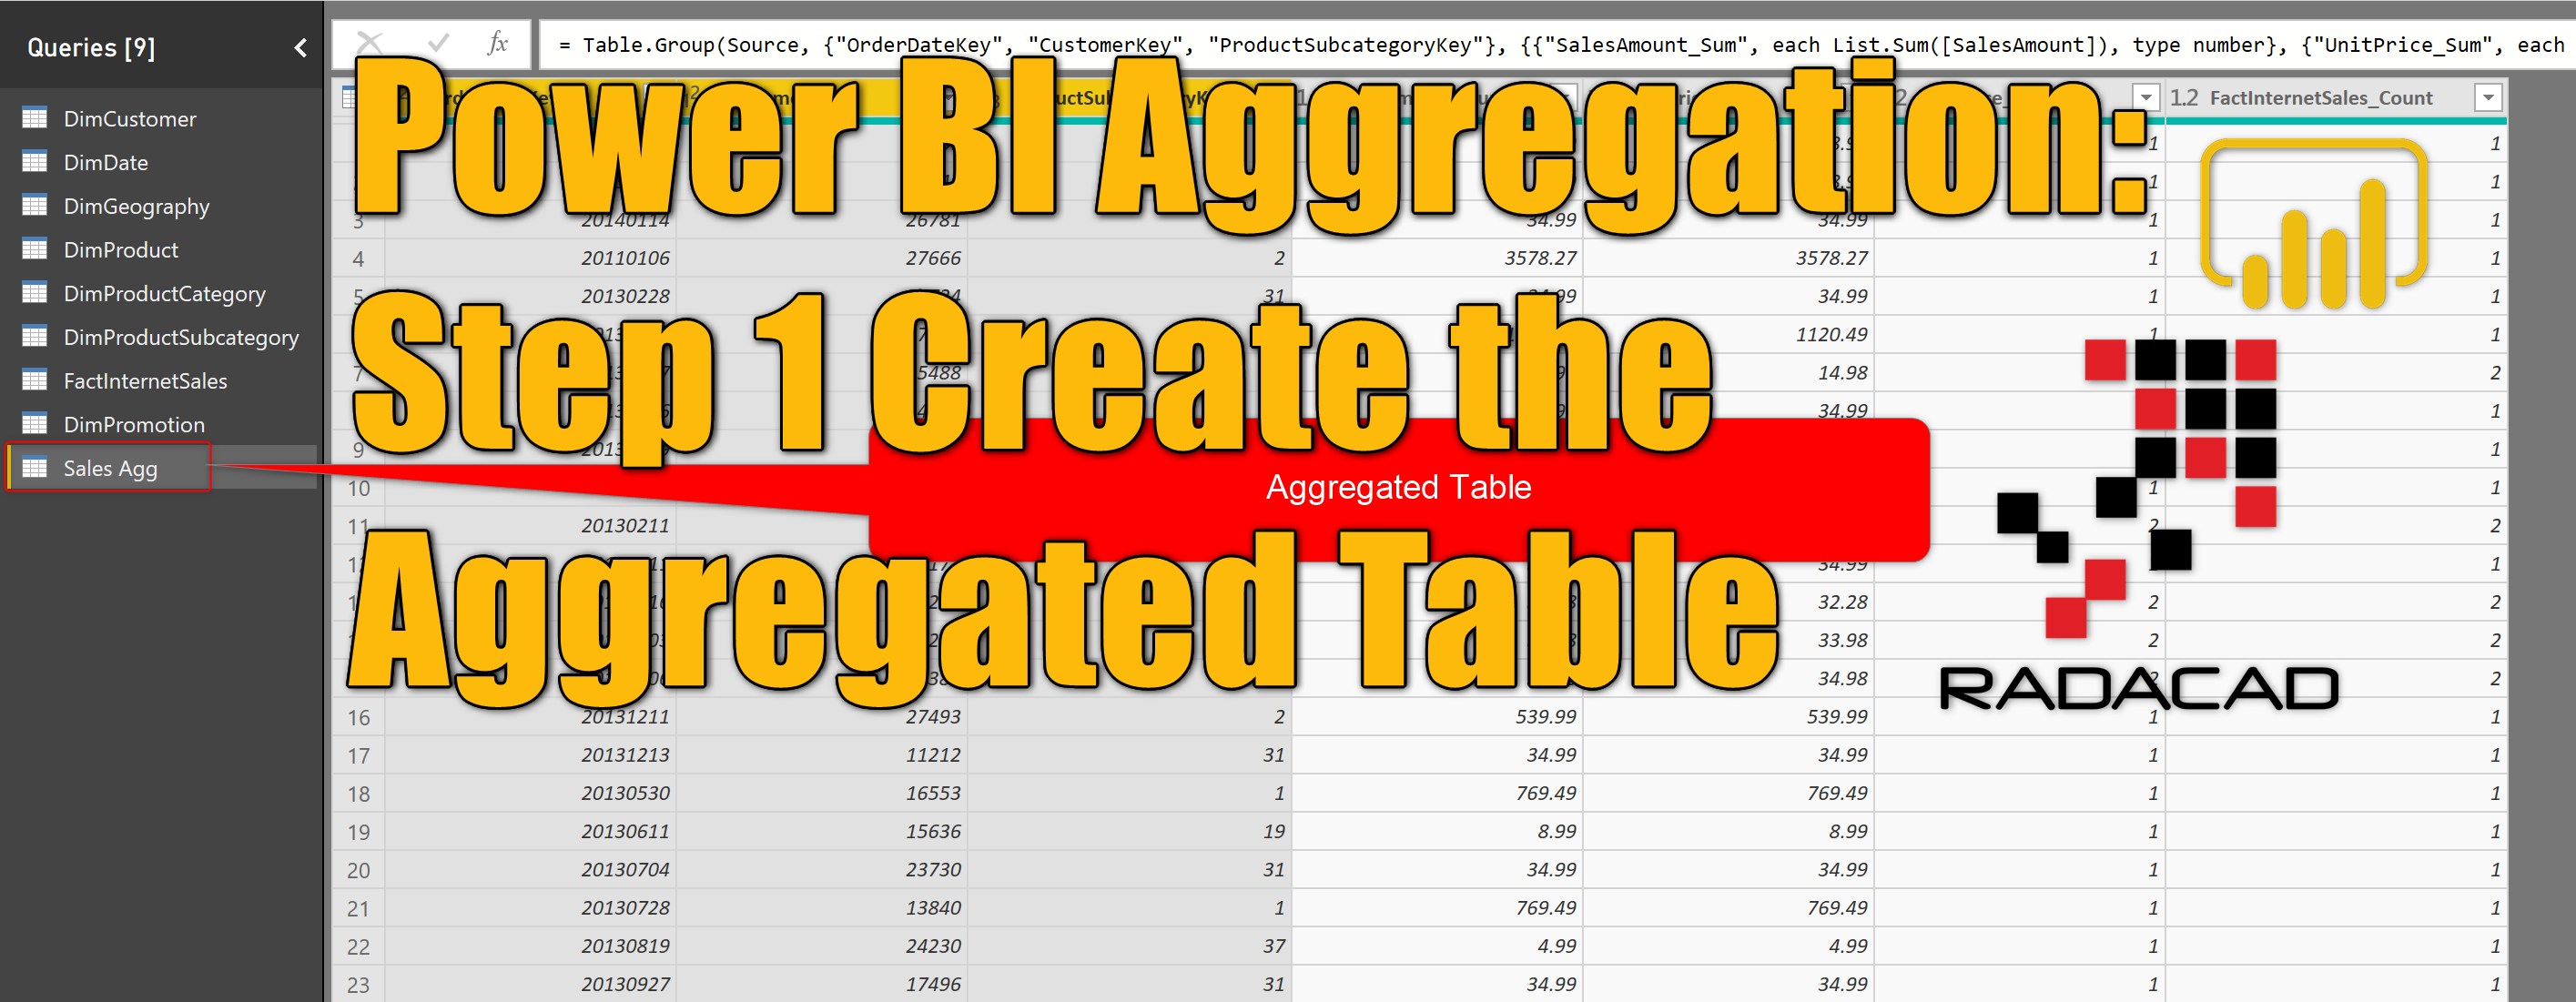
Creating the Aggregated Table
Go to Power Query Editor, and select the FactInternetSales table, the aggregated table that we will create in this example, is going to be on three fields; OrderDateKey, CustomerKey, and ProductSubCategoryKey. The first two fields Exist in the FactInternetSales, but not the third one. However, using relationship columns, we can retrieve that.
Scroll to the right in the FactInternetSales table columns to find Product, then click on Expand. In the Expand options, just Select ProductSubCategoryKey.

Now that you got the ProductSubCategoryKey in the table, you can apply the Group By. But if we use Group By in the existing query, we will change it to the aggregated table. We do, however, need to keep the existing intact. So create a REFERENCE from the existing FactInternetSales table (To learn more about the Reference and the difference with the Duplicate, read my article here). Name it as Sales Agg, and let’s do the group by on that. In the Transformation Tab, click on Group By;

When the Group By dialogue box pops up, choose Advanced

Choose the three fields of OrderDateKey, CustomerKey, and ProductSubcategoryKey in the Group By fields

Then add four aggregations as below;

After building this table, let’s call it the Sales Agg table. Here is a screenshot of the Sales Agg table.

Key Consideration for upcoming steps
Aggregation columns in the aggregated table should follow specific rules.
Rule #1: Exact Match for Data Types of Aggregations by Sum, Min, Max, Average
Columns that you apply an operation such as Sum, Average, Min, or Max, should have exactly the same data type as the original source column after the aggregation. If they don’t, change the data types to have the same.
SalesAmount field in the FactInternetSales has a Decimal data type (if not, change it to that)

The SalesAmount_Sum column in the Sales Agg table also should have the same data type. In this case, Decimal.

Note that having the Decimal data type is not important to the rule. It is important to have both data types exactly matching.
This process, in our example, should be completed for the two columns of SalesAmount_Sum and UnitPrice_Sum.
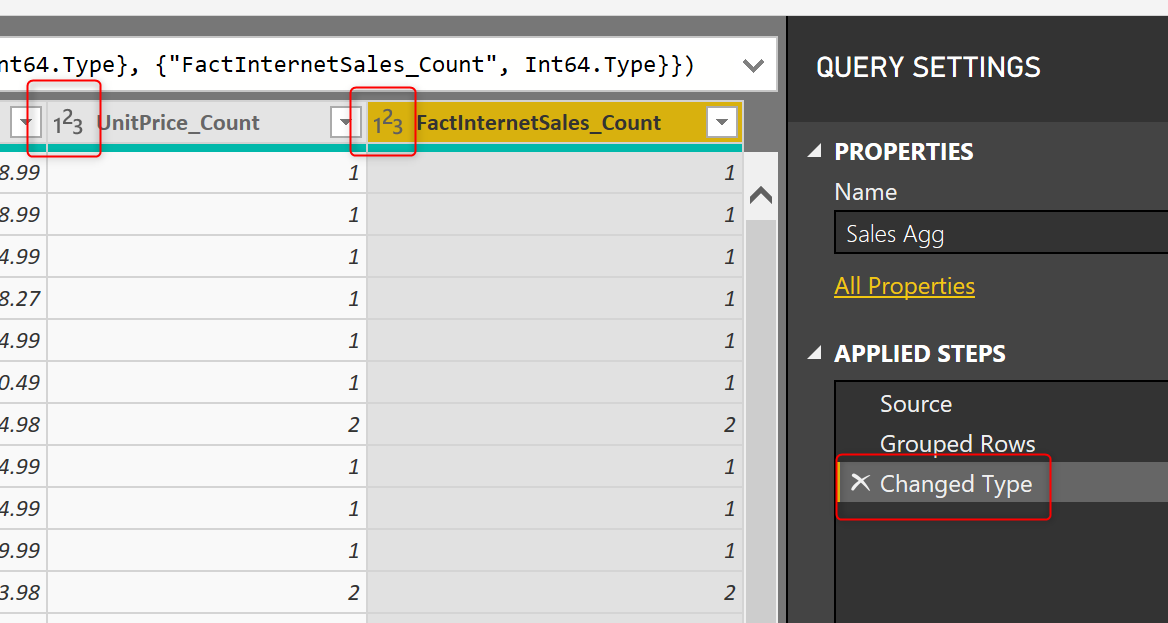
Rule #2: Whole Number data type is mandatory for aggregations by Count
Any aggregations that use Count as the aggregation function should have the data type of the whole number or, let’s say, Integer. In our sample table, we have two columns with the Count function:

You should make sure that these two columns have a Whole Number data type after Group by transformation;
The two rules mentioned above will be important in the next steps of aggregation blog posts when we are configuring aggregation in Power BI.
Aggregated Table is an Import Table
The aggregated table that we have created is named Sales Agg. Because this table is much smaller than the FactInternetSales table, it can be stored in the memory. This way, we get the best performance of query response time when we query something at the aggregated level.
Your Data model in Power BI should have tables below it now after completing this step:

Congratulations, You have built the aggregated table, and now you can create relationships between this table and the three dimension tables: DimCustomer, DimDate, and DimProductSubcategory. Here is the full relationship Diagram;

In the next step, I will explain what the storage mode is and how important is the Dual storage model configuration when we use the aggregations.
If you like to learn what is the Aggregation, and how it can be useful, read the previous post here.
Previous and Next Steps
- Power BI Fast and Furious with Aggregations
- Power BI Aggregation: Step 1 Create the Aggregated Table (the current article)
- Dual Storage Mode; The Most Important Configuration for Aggregations! Step 2 Power BI Aggregations
- Power BI Aggregations Step 3: Configure Aggregation Functions and Test Aggregations in Action
- Multiple Layers of Aggregations in Power BI; Model Responds Even Faster


Reza is author of more than 14 books on Microsoft Business Intelligence, most of these books are published under Power BI category. Among these are books such as Power BI DAX Simplified, Pro Power BI Architecture, Power BI from Rookie to Rock Star, Power Query books series, Row-Level Security in Power BI and etc.
He is an International Speaker in Microsoft Ignite, Microsoft Business Applications Summit, Data Insight Summit, PASS Summit, SQL Saturday and SQL user groups. And He is a Microsoft Certified Trainer.
Reza’s passion is to help you find the best data solution, he is Data enthusiast.
His articles on different aspects of technologies, especially on MS BI, can be found on his blog: https://radacad.com/blog.
Hi Reza,
I follow your instructions and I have one question
The process did not generate new table (Sales Agg)
It convert it to a smaller table with specified columns you picked
I had to duplicate the fact table in order to create aggregation table
Do I miss something?
Also when you try to convert the unitPrice_Count and SalesAmount_Count
it asked me if I want to change all table to import mode?
Thanks
Hi Oded
You are right. there was a step missing in my explanation. You have to create a REFERENCE from FactInternetSales table and name it as Sales Agg. I added that step in the blog post. let me know if you have any other questions
Cheers
Reza
Hi Reza!
When I finished the steps, PBI told me “This step results in a query that is not supported in Directquery mode.” and presents a button labeled “Toggle All tables to import mode.”
What I should do?
Thanks
Rolando
Hi Rolando
You should change the storage mode of the new Sales Agg table to Import Mode. read the next post about it.
I haven’t tried this yet, but does the aggregated table benefit from query folding to ensure it’s creation is efficient? And what if additional query steps were added to the Fact table query? My thinking is all about whether the creation of the aggregation table is efficient (or when can it be inefficient) in PQ.
Hi Matt
The aggregated table can be created anywhere. Using T-SQL, or in Power Query, or even in DAX. Depends on the main table’s size and Group By parameters, you may decide to do it in Power Query or in T-SQL.
Will the fact table and dimension table have to be belonging to same database ? I mean will the aggregations work if we need to that between the tables from two different data sources ?
Hi Nikhil
It would work absolutely fine. You can create the aggregated table from tables coming from multiple sources, because the aggregated table is at the end an import-data table
Cheers
Reza
Hi!
Will the fact that i created the aggregated table change the refresh interval of the report?
I mean, in direct query mode i’m able to refresh every 15 mins, and with import i’m only able to refresh 8 times a day.
Thanks!
Hi Henrique
The aggregated table would be an import table, and import table then would be subject to refresh frequency of the Power BI datasets (8 times a day with Power BI Pro, and 48 times with Premium)
your DirectQuery table, however, won’t need a refresh
Cheers
Reza
Hi Reza,
Is there any possible way to utilize an aggregated table with dynamic rls?
Aggregated tables works like any other tables in your model.
if you have RLS implemented, then you need relationship to all other tables so that the RLS filter propagates. This means your aggregated tables also need relationship with your RLS rules tables.
Cheers
Reza