
Power BI files can easily get big. You can have 50 tables in a Power BI model, and 25 reports. When Power BI file gets in that size, maintenance is always an issue. It will take lots of time to find out if all of those 50 tables actually used in reports and visualization or not. In this post, I’m going to share a tool that I use myself that saves you time (and as a result money) to clean up your Power BI report much faster. The tool that I am introducing is created by RADACAD team, and this is the very first version of this product. The tool is free to use, and you can download it from below link.
Defining the Problem
You have a Power BI file that has 50, or even 100 tables in it. In fact, such scenario happens a lot. Despite the fact that I always recommend preparing your data to be modeled and bring only what needed, still I see many Power BI reports that has hundreds of tables in it. The worst thing about this is that not all of those tables are used in the report! Many people think that having more tables in your model is better because it enables them to analyze data based on every field they want. This is somehow true. However, More tables will make things more complicated and confusing. Look at below Power BI Model;
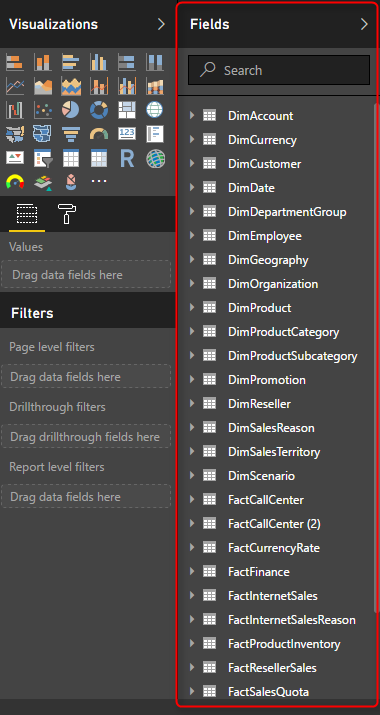
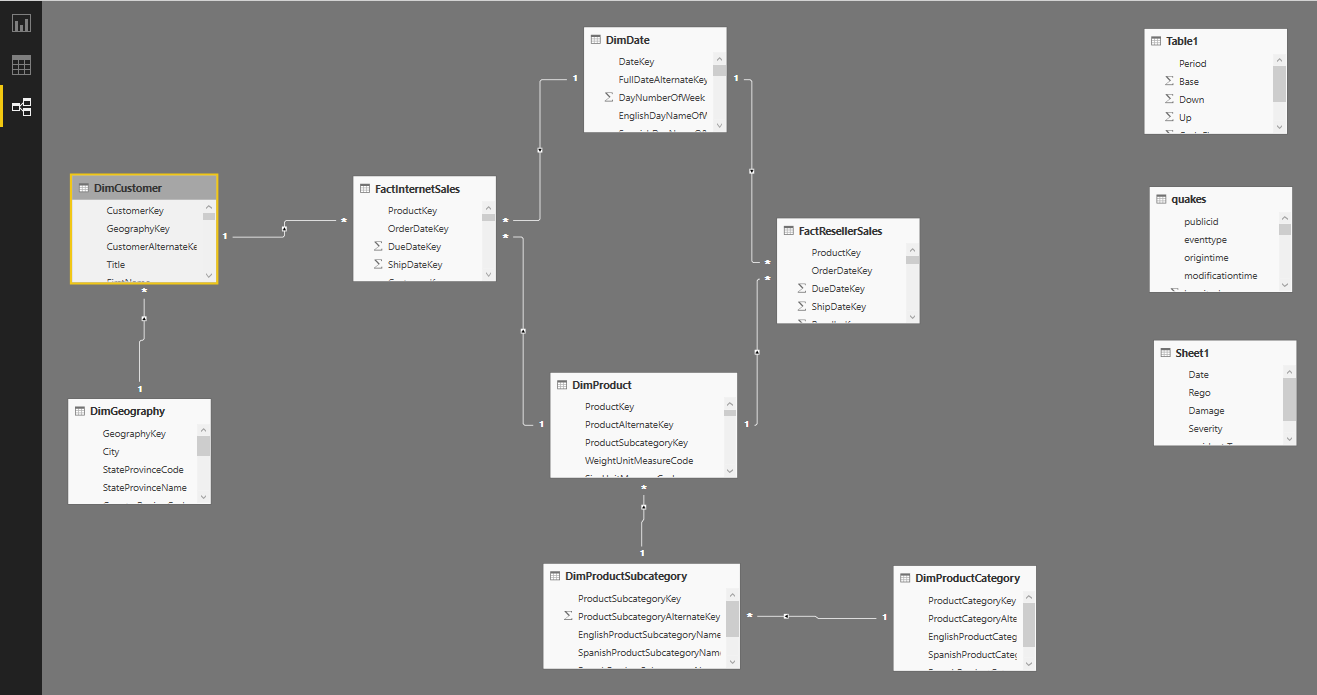
There are 29 tables in the list above, and each of those tables also has tens of fields in it! It gets even worse when you look at the relationship model;

It is nightmare, isn’t it?! You never want to maintain such a model. Especially if you just introduced to a project, and you see such a complicated model. The problem is that not all of these tables and fields are used in the reporting!
Not all of these tables and fields are used in the reporting! This Data Model needs clean up.
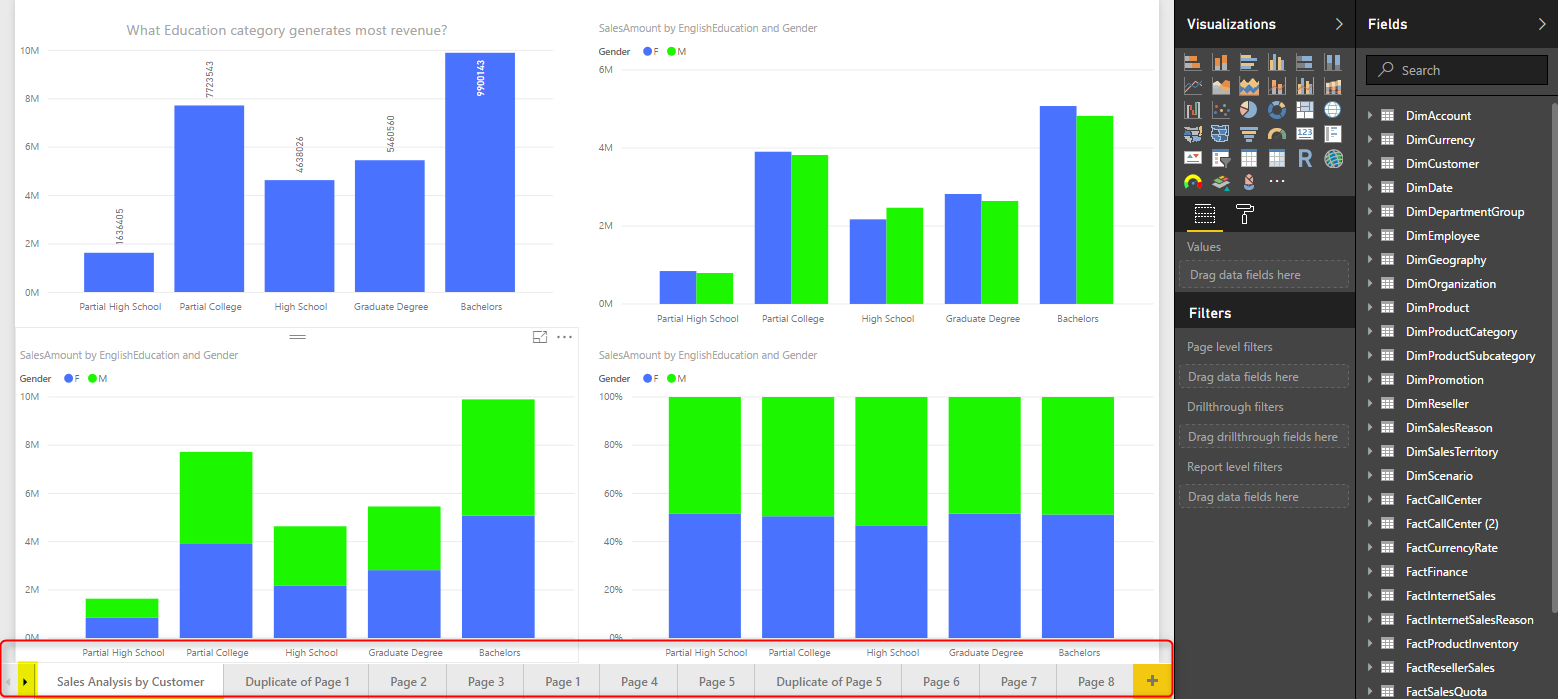
So the problem is cleaning up the model, and your Power BI report might already have more than 20 report pages. This sample report also has 20+ report pages!
Finding Tables/Fields that are used in Visualizations
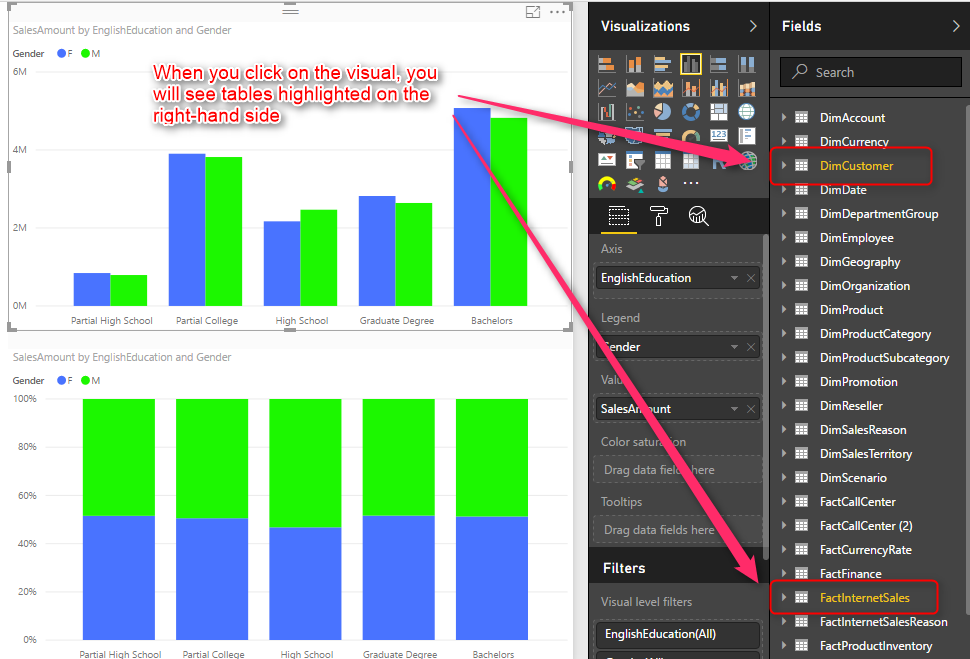
Normally when I see a model like above, the first action I take is to look at tables that are not used to remove them, or at least hide them. At the moment in Power BI Desktop to find which fields are used in a visual, you can click on the visual, and you will see tables highlighted on the right-hand side, so it means these tables and fields are used in the visual.
However, when you have 20+ report pages, and on each page, you have 6+ charts, then it is taking you a lot of time to do so! So, now the problem is;
Finding tables/fields that are used in the visualization (or reporting)
Introducing a Tool: Power BI Helper
Power BI Helper is a tool that finds all tables and fields that are USED in the visualization and reporting side. It makes your job much easier. Instead of clicking on every single visual and finding out that which tables are not used at the end, this tool does that for you very fast! This tool is built by RADACAD team and licensed free to use at the moment. You can download it from this link:
Download Power BI Helper
Let’s see what this tool does;
After installing the Power BI Helper, Open Power BI Helper either from your Desktop, or Programs.
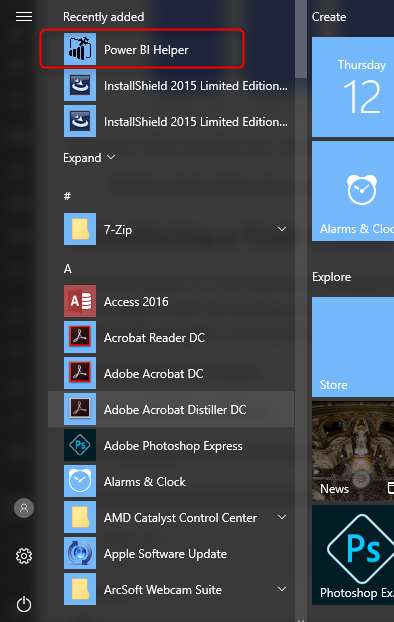
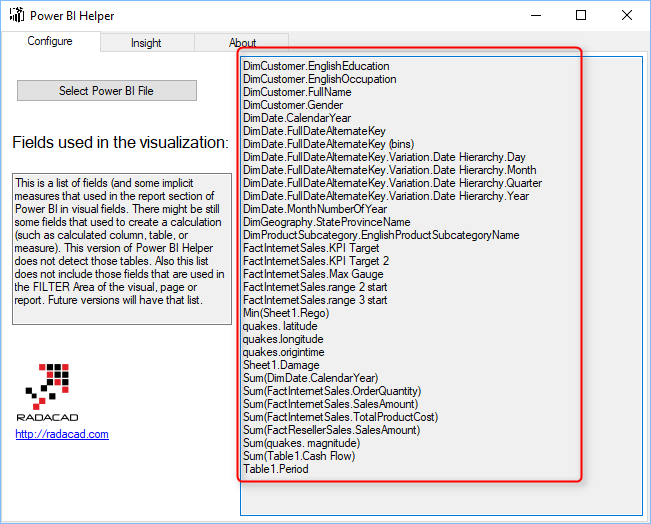
When the application is opened, click on Select Power BI File;

Select the *.pbix file here, and then you will see list of all fields used in visualization section of reports;
Also; if you go to Insight tab, you will see the list of Tables that are used in the report. These are tables that at least one of their fields used in any of reports (for visualization or even for filtering);
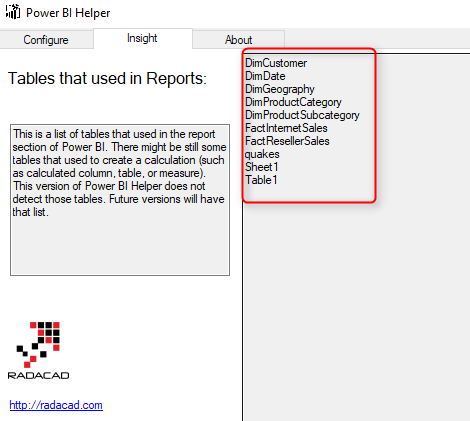
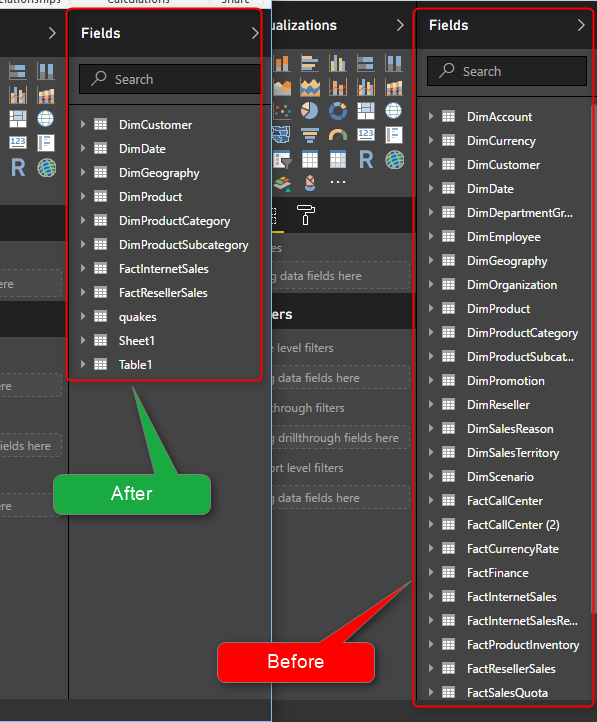
So; Problem Solved! Now you have the list of tables that are used in the report. You can see only 10 out of the 29 tables are used in the Power BI report!
How to Use This Result
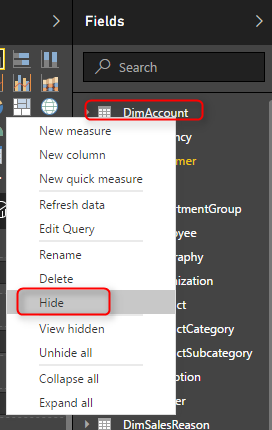
Only tables that you see in the list above are used in reporting section. This means you can easily right click and hide all other tables.
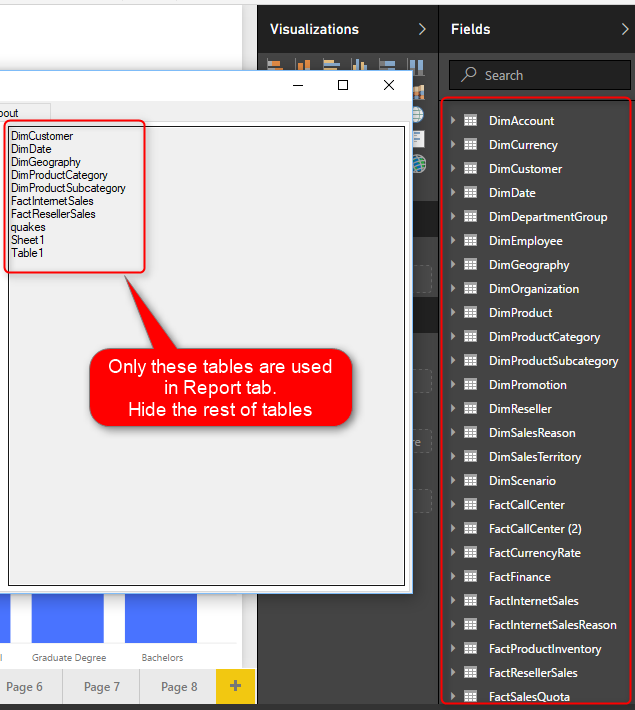
Hiding a table does not remove it from the model. However, It will remove it from the list of fields in the Report tab, and avoid confusion for report developer.
You may also want to remove tables that are not used as well. Now, here is the tricky part; this tool is just at the very first version. It is versioned 0.1! So still many features to be added, and we hope to provide frequent update releases on that. Power BI Helper doesn’t tell you if those tables are used in a relationship or not, and it doesn’t tell you if fields from those tables are used to create some calculations (such as a calculated column, table, or measure). Next versions of this tool will have those features. For now, you have to do that check manually. However, having the list of tables that are used only helps a lot. I can find tables that are not used easier, and then remove them from the model. So my model now ended up as this number of tables in the report area;

Much cleaner, isn’t it. Even after removing extra tables, you get much cleaner model as below;
This model is now much easier to maintain, and much more efficient.
What Power BI Helper version 0.1 Does?
This product is still in version 0.1 (means the very first version); This tool helps in below scenarios;
- Identify fields that are used in the Fields section of visualizations
- Identify tables that are used in the Fields or Filter sections of report tab
Providing such result then will help you to hide extra tables from the report. Or even remove them (this part needs some extra manual investigation as of now).
Upcoming Features
For the very first version; We have many limitations! These limitations will be lifted in future versions. Some of these limitations which will be added as feature in next versions of Power BI helper are;
- List of fields used in the Filter area
- List of tables or fields used to create a calculation (calculated table, column, or measure)
- List of tables or fields used to create a relationship to other tables
- Details of what fields or tables used in a specific report or visual
- Diagram view and dependency view of reports and visuals with tables and fields from the model
- Applying Changes to the PBIX file (Like hiding tables, adding some descriptions)
Summary
In this post, I introduced a tool to you that saves you some time for cleaning up a Power BI report. I use this tool myself whenever I get a new piece of a project in my consulting services. This tool is free to use, still the first version. So please download it and let us know how it works for you. All of your suggestions are most welcome.


Reza is author of more than 14 books on Microsoft Business Intelligence, most of these books are published under Power BI category. Among these are books such as Power BI DAX Simplified, Pro Power BI Architecture, Power BI from Rookie to Rock Star, Power Query books series, Row-Level Security in Power BI and etc.
He is an International Speaker in Microsoft Ignite, Microsoft Business Applications Summit, Data Insight Summit, PASS Summit, SQL Saturday and SQL user groups. And He is a Microsoft Certified Trainer.
Reza’s passion is to help you find the best data solution, he is Data enthusiast.
His articles on different aspects of technologies, especially on MS BI, can be found on his blog: https://radacad.com/blog.
Great work!
Great idea.
Looking forward to the next update that includes fields used in calculations
It’s GREAT!!!
I will definitely use this