
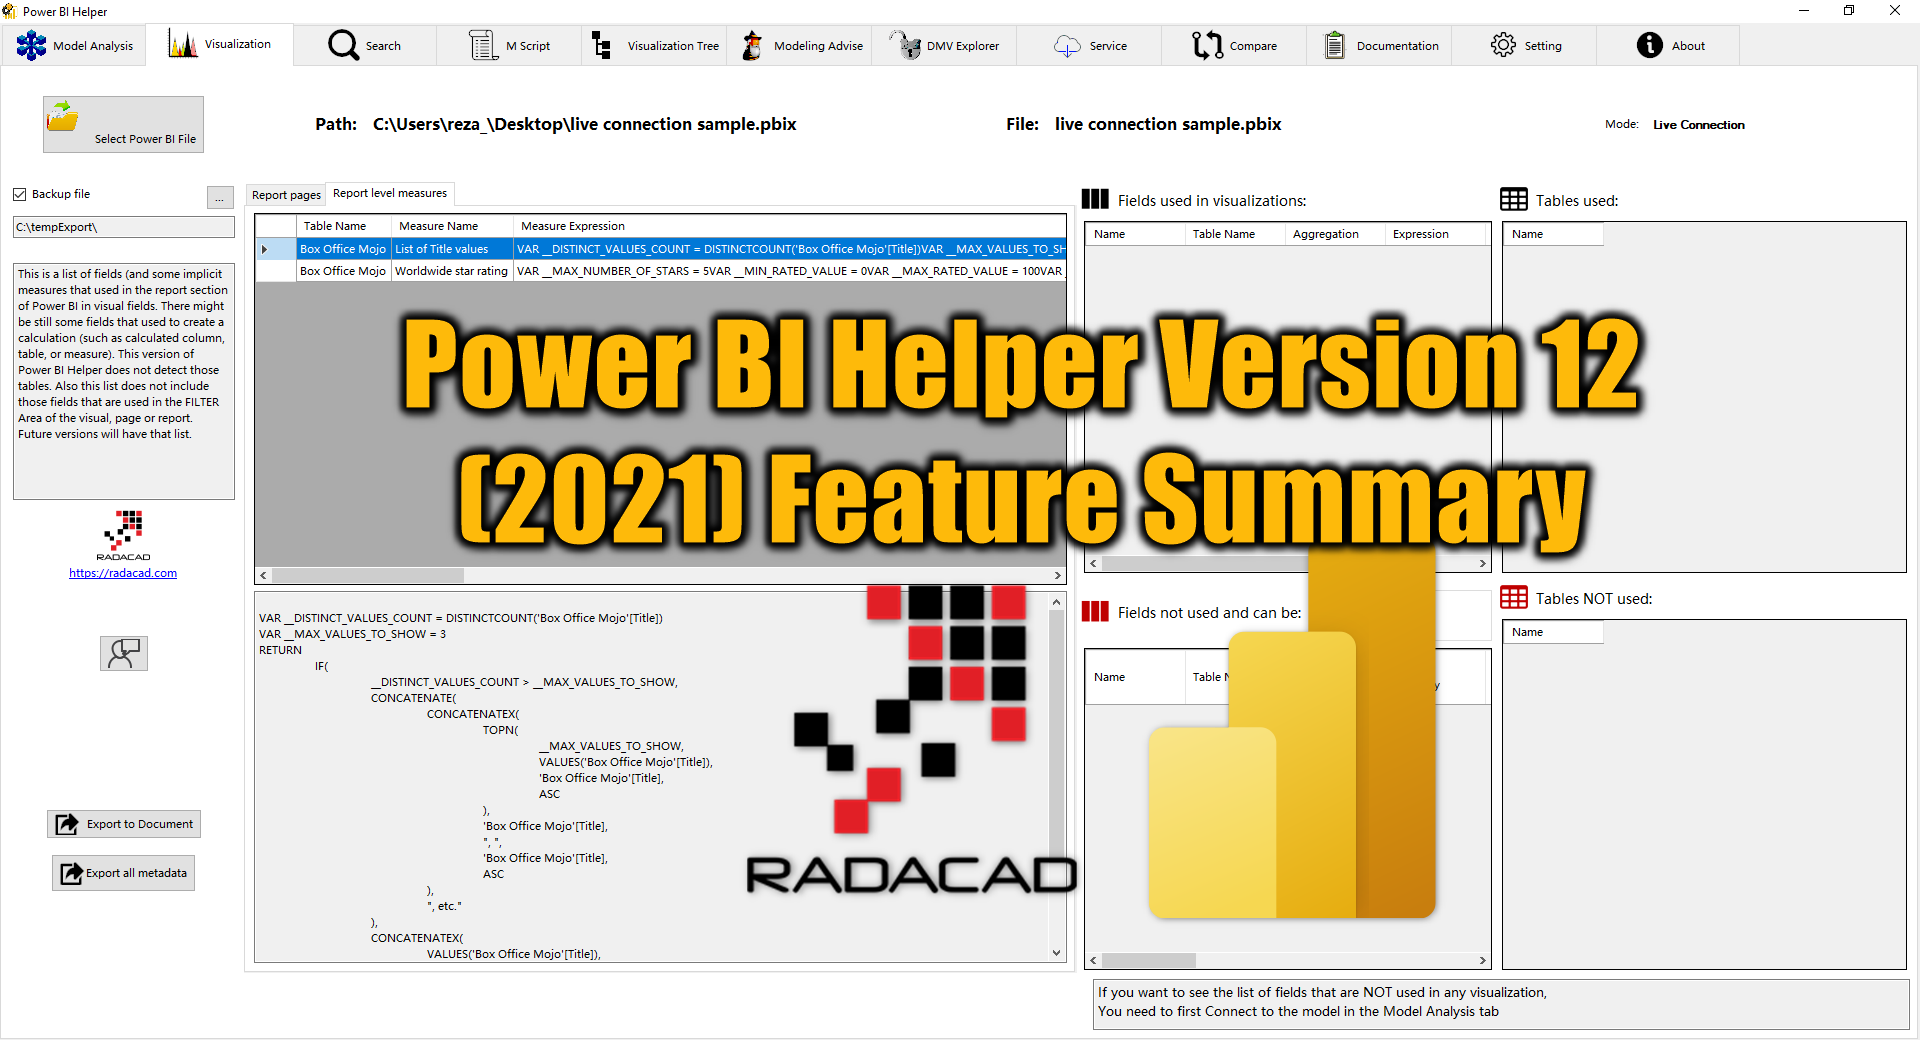
Happy New Year. We wish this be a year full of happiness and joy for all of you. We are glad to let you know that version 12 of Power BI Helper is now available to download with the below new features;
- Detecting the storage mode of tables (DirectQuery, Dual, Import)
- Detecting the connection mode of the file (Import, DirectQuery, Live Connection, Composite/Mixed)
- Report level measures
- Compare two files based on their report level measures
- Analyzing the visualization just by selecting the model
- Feedback form
- Documentation of all the above new information
- bug fixes
Detecting the storage model of tables (DirectQuery, Dual, Import)
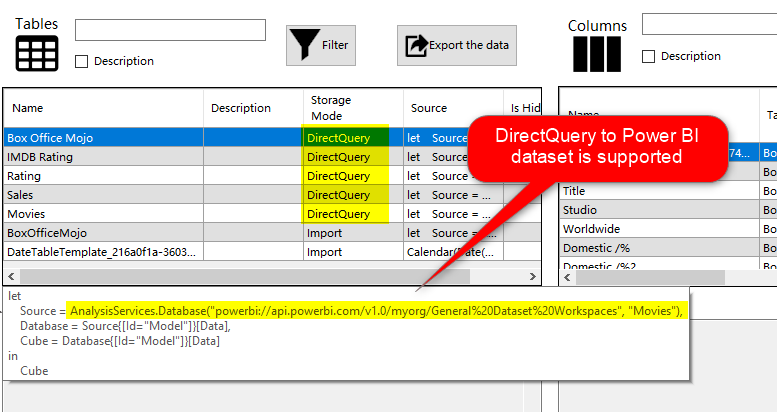
We’ve added a couple of columns for the table’s metadata: Storage mode, and Source. These two columns give you valuable information about the table. For example, in a composite model like below, there are different tables with different storage modes.
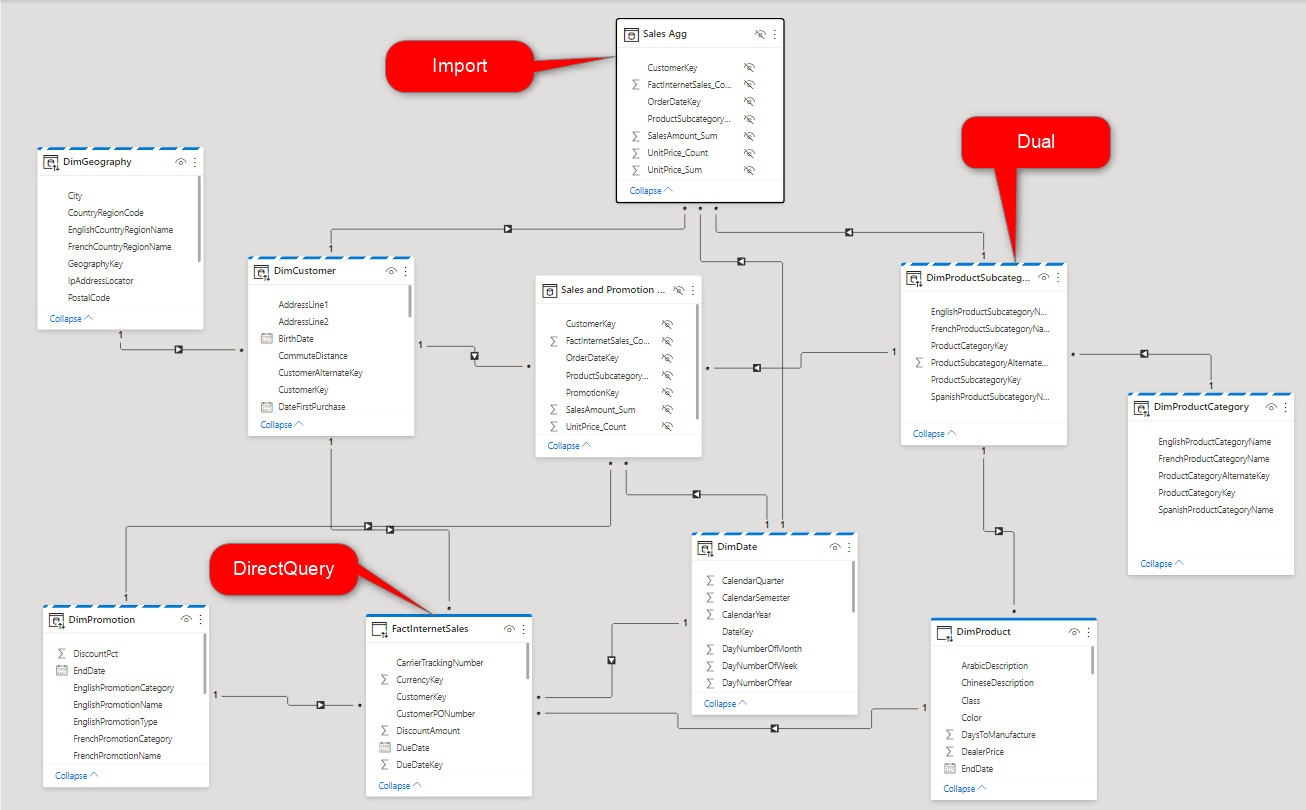
In Power BI Helper, you can find out the storage mode of each table
As you can see, the tooltip and the Source column shows where the source of the table is coming from. The Composite model to Power BI dataset is also supported.
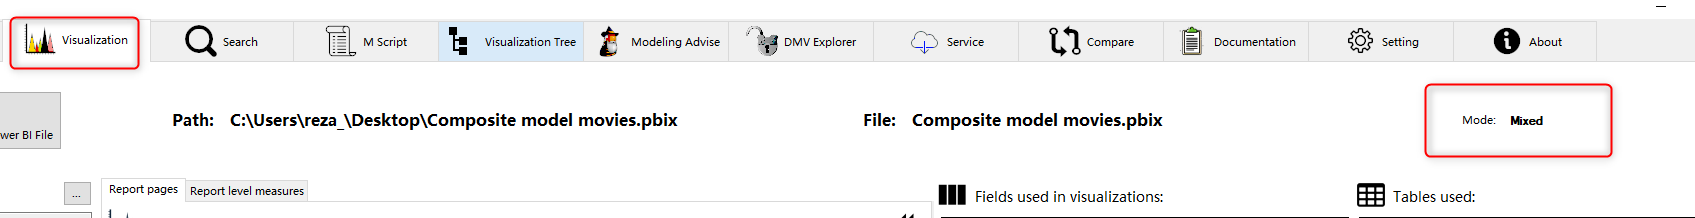
Detecting the connection mode of the file (Import, DirectQuery, Live Connection, Composite/Mixed)
Power BI Helper can detect what is the connection mode of the Power BI file in the visualization tab. Based on the file, the options are: DirectQuery, Live Connection, Import, or Mixed (Composite)
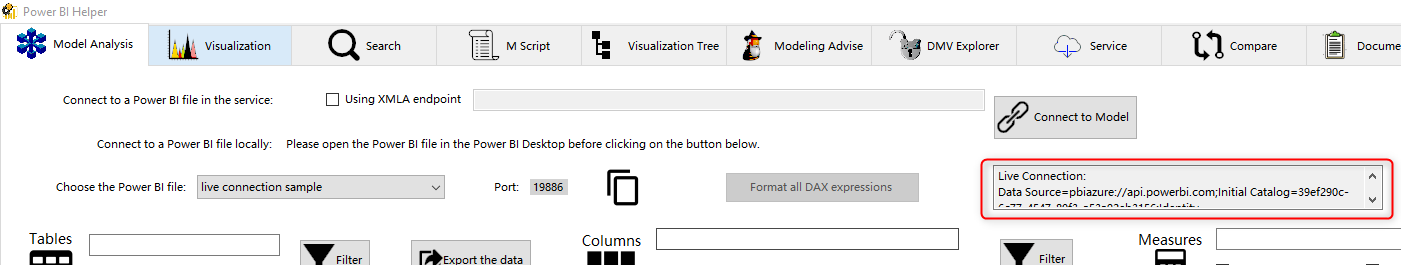
If the connection mode is live, the data source will be showed in the Model analysis tab.
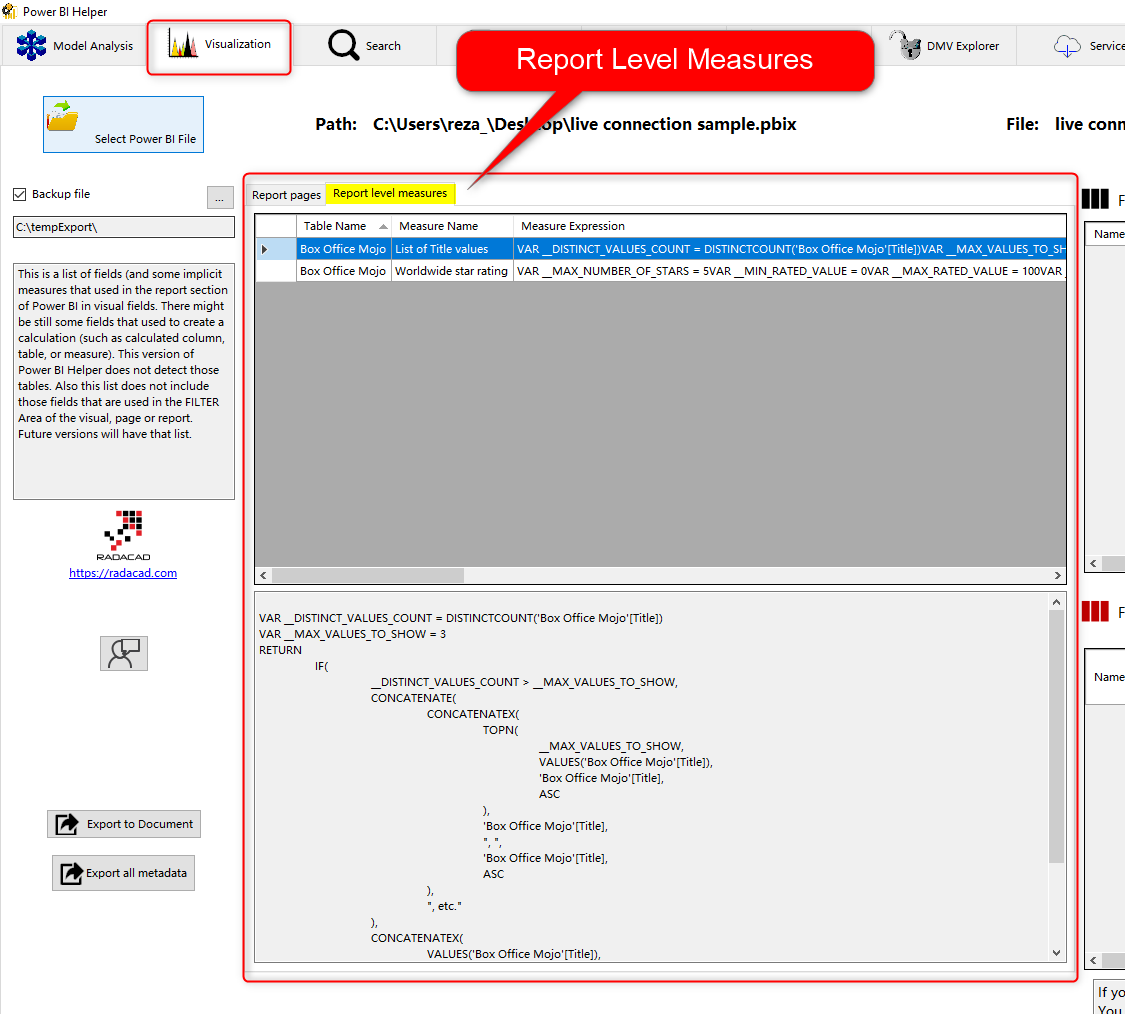
Report level measures
If your file using live connection, then you might have Report Level Measures. You can see list of all the report level measures in the Visualization tab now.
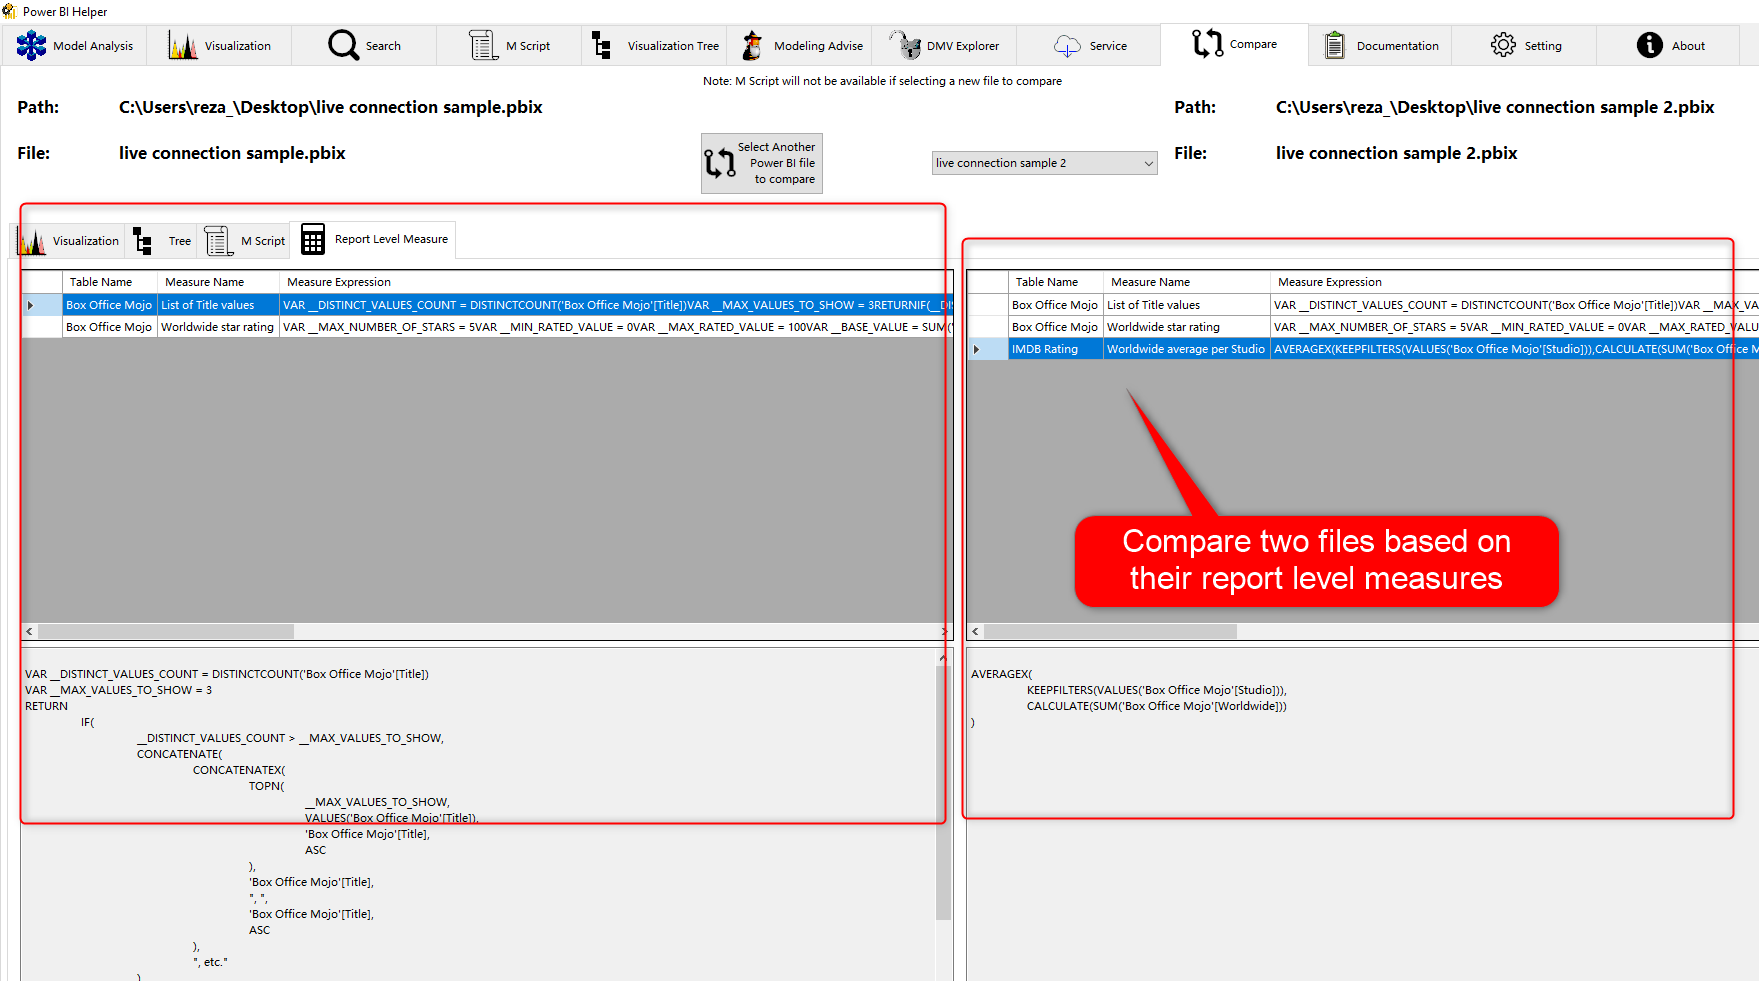
Compare two files based on their report level measures
In the prior versions of Power BI Helper, you could compare two Power BI files together based on their visualization components. Now you can also compare them based on their report level measures. This is practically useful to compare two files both with a live connection to the same data source and see what are the differences in their measures.
Analyzing the visualization just by selecting the model
If you are connected to the model, you no longer need to select the PBIX file (this was previously needed to get the visualization analysis of the file). We have streamlined the process for you. When you connect to the model, the visualization would be analyzed automatically.
Feedback form
We value your opinion, feedback, comments, and concerns. We have embedded a form in the application so that you can contact us easier. You can choose if you wish to be contacted back (in that case make it an inquiry and provide your email address), or just provide an anonymous opinion. This option is available in the About tab.

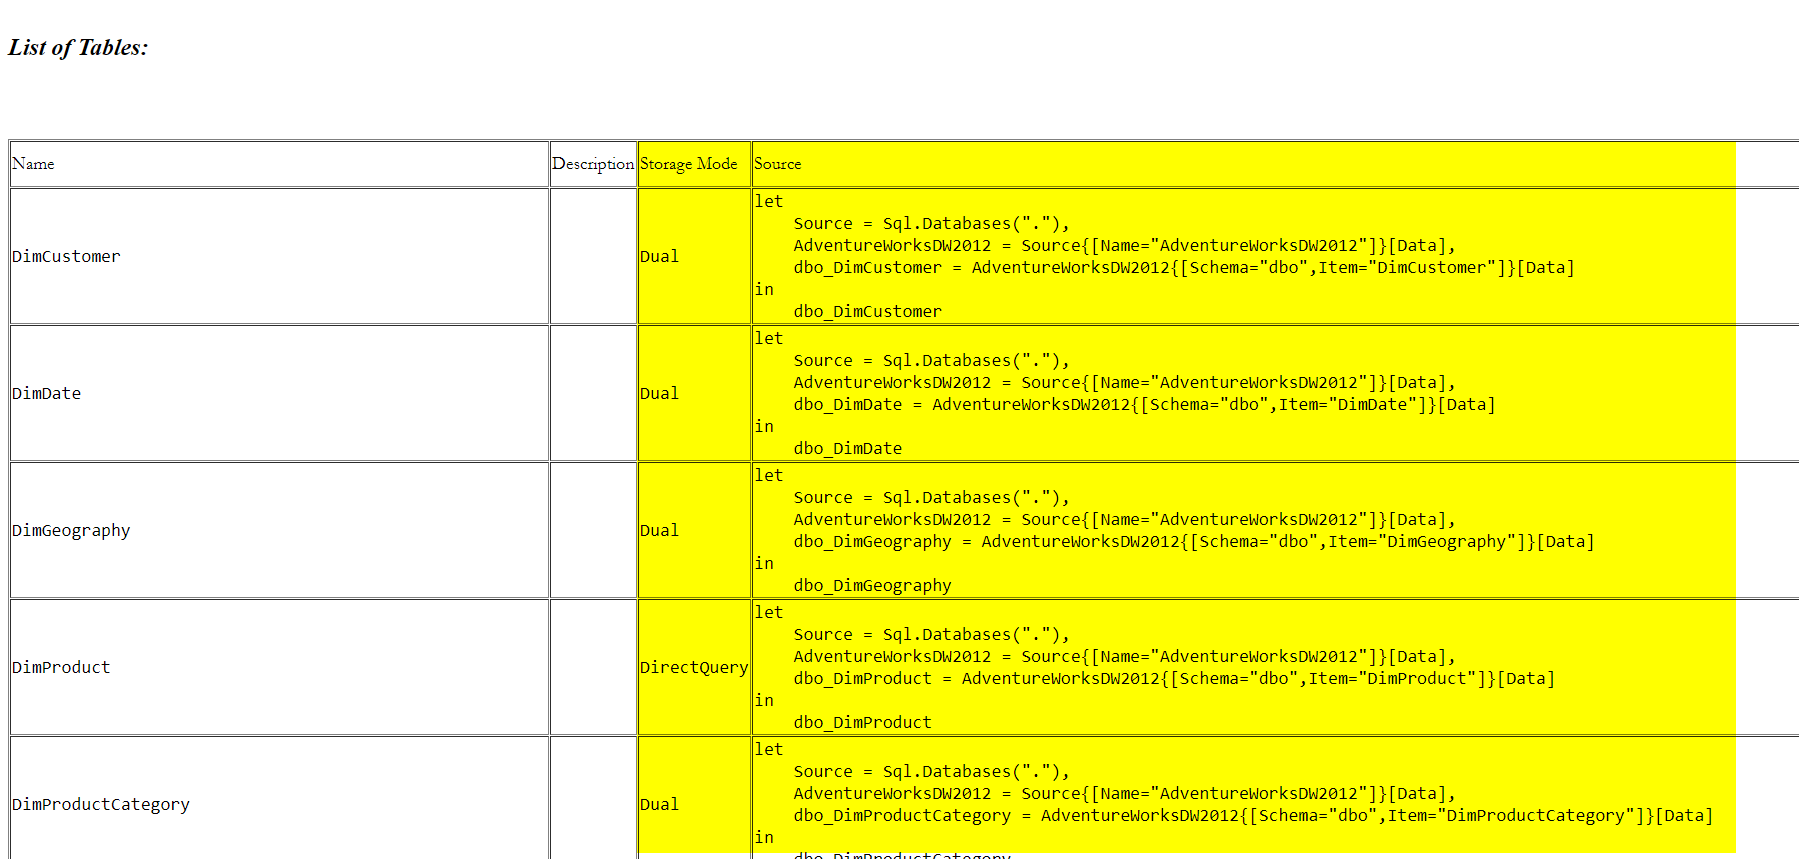
Documentation of all the above new information
All the new metadata information is also available in the exported document. Below screenshot shows how the storage modes are presented.
We hope you enjoy this new update. We are looking forward to hearing your valuable feedback and opinions.
Video


Reza is author of more than 14 books on Microsoft Business Intelligence, most of these books are published under Power BI category. Among these are books such as Power BI DAX Simplified, Pro Power BI Architecture, Power BI from Rookie to Rock Star, Power Query books series, Row-Level Security in Power BI and etc.
He is an International Speaker in Microsoft Ignite, Microsoft Business Applications Summit, Data Insight Summit, PASS Summit, SQL Saturday and SQL user groups. And He is a Microsoft Certified Trainer.
Reza’s passion is to help you find the best data solution, he is Data enthusiast.
His articles on different aspects of technologies, especially on MS BI, can be found on his blog: https://radacad.com/blog.