
Table visual is one of the most commonly used visuals. In Power BI, you can turn off the total row (when it won’t make sense to have the total) entirely. However, you cannot turn off the total for some columns and keep it working for the others. Using a DAX function, you can, however, do this easily. Let’s see how it is possible.
Total Row in the Table Visual
In the table visual in Power BI, you get the total row by default;
You can disable the total row entirely using the Format tab of the visual, and then under the Total;
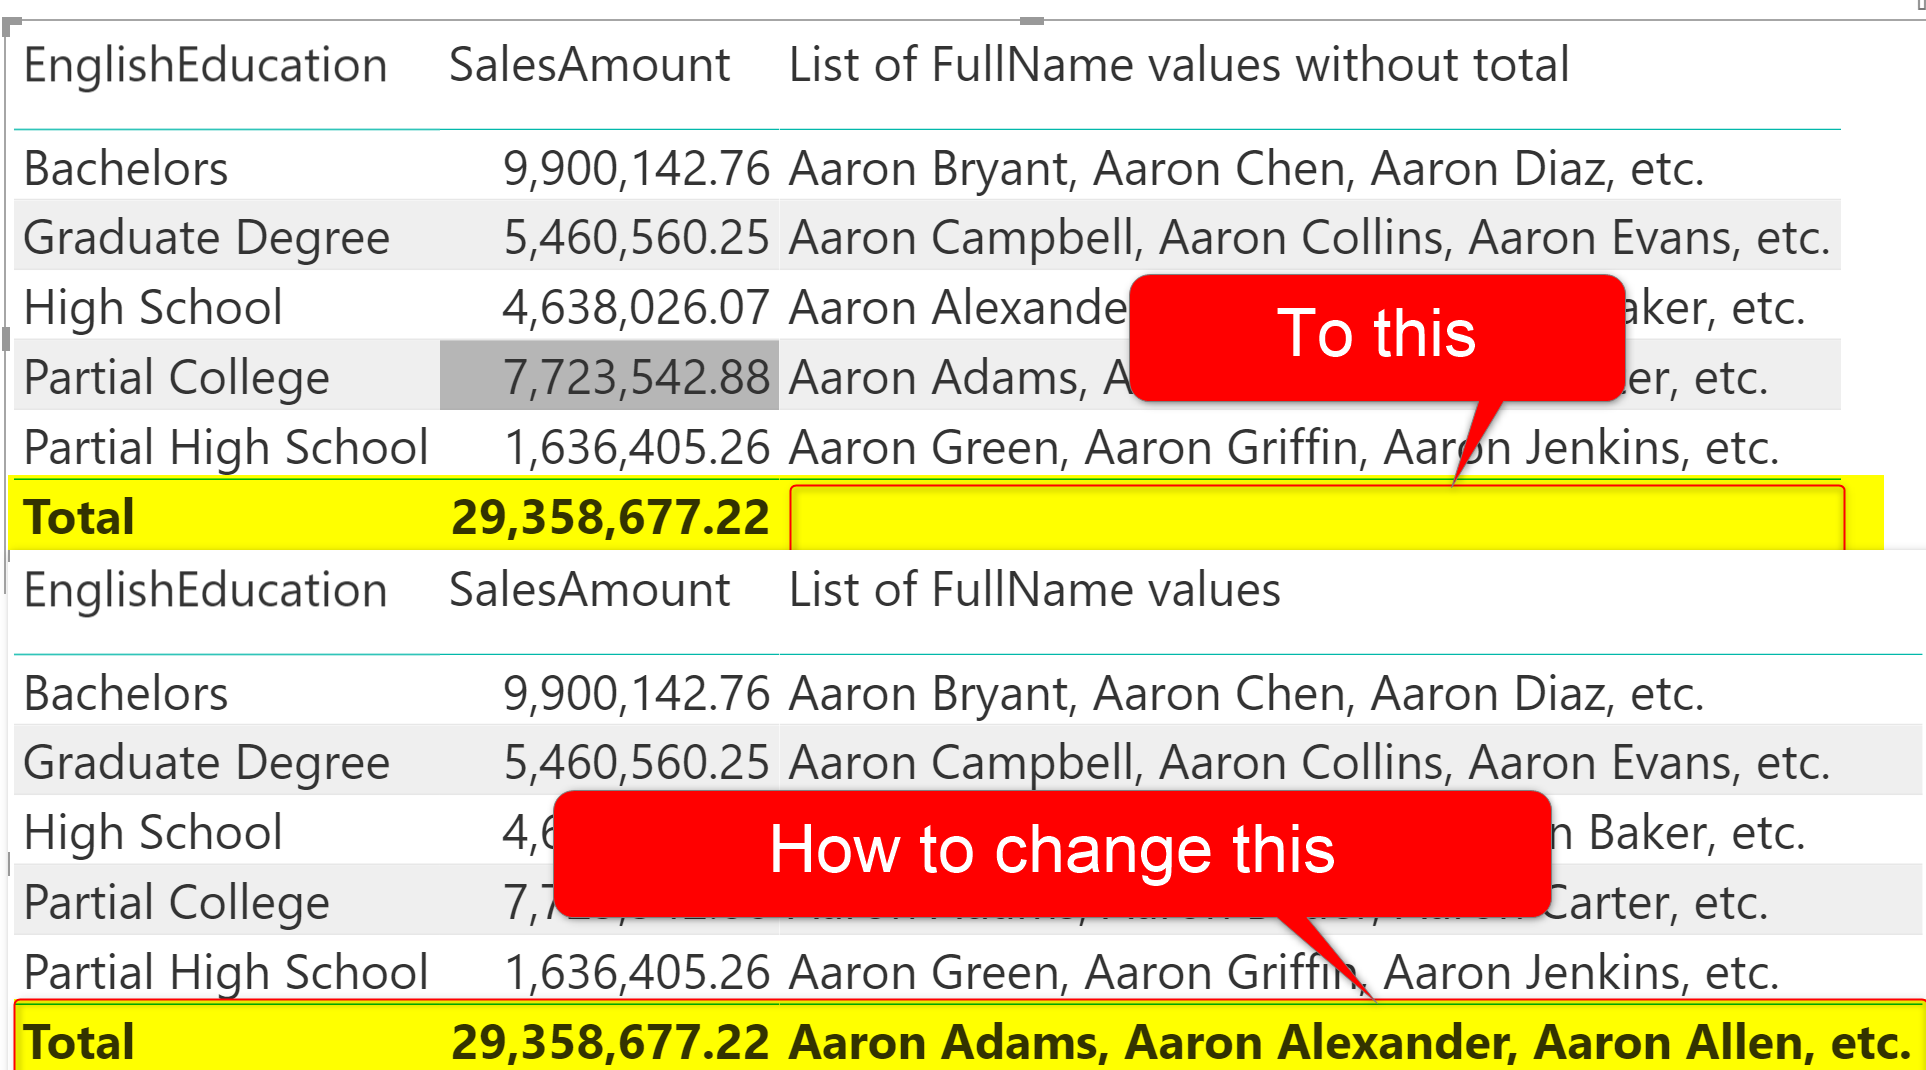
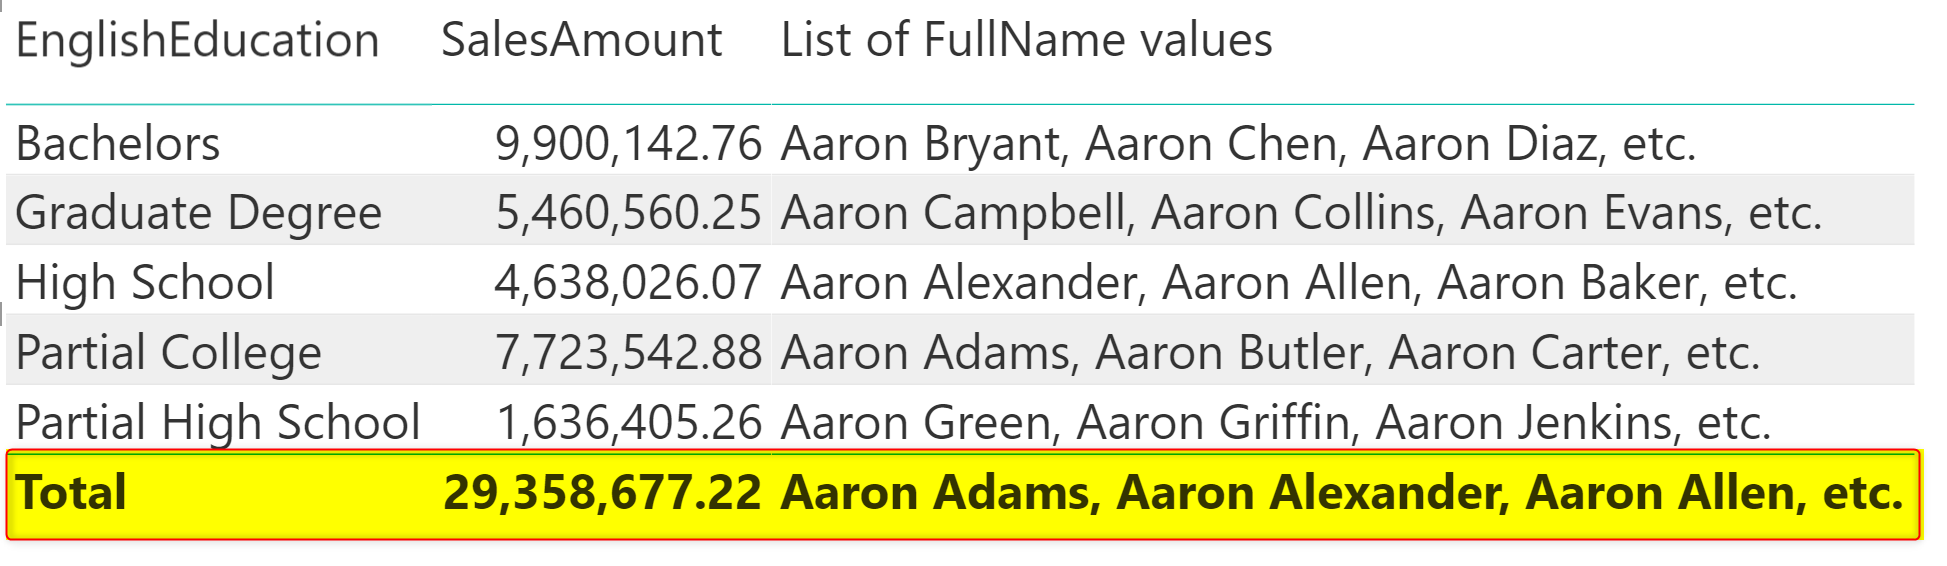
There are scenarios that you want to only turn off the total value calculation for one of the columns. turning off the entire total row might not be the best option in those cases. For example, the total for SalesAmount in the above example is good to have, but the total for the List of FullName values is not necessary. The List of FullName values is showing the three custom names under each category, and when we are in the total row, that means everyone. So it is better to get it removed. I show you two ways of removing this total value.
The DAX Way: ISFILETERED
There is a very useful function in DAX that can help you to determine if the value showed in a visual, filtered by a field/table or not. The function is called IsFiltered. This DAX function, get the field/table name as the input and returns a true or false value, meaning that if the context in which the calculation is running, is filtered by that field or not.
ISFILTERED(<table or column name>)
To show you how this function works, I write a measure like below:
Is Filtered = ISFILTERED(DimCustomer[EnglishEducation])
If I add this into my table visual, I can see when this function returns TRUE or FALSE
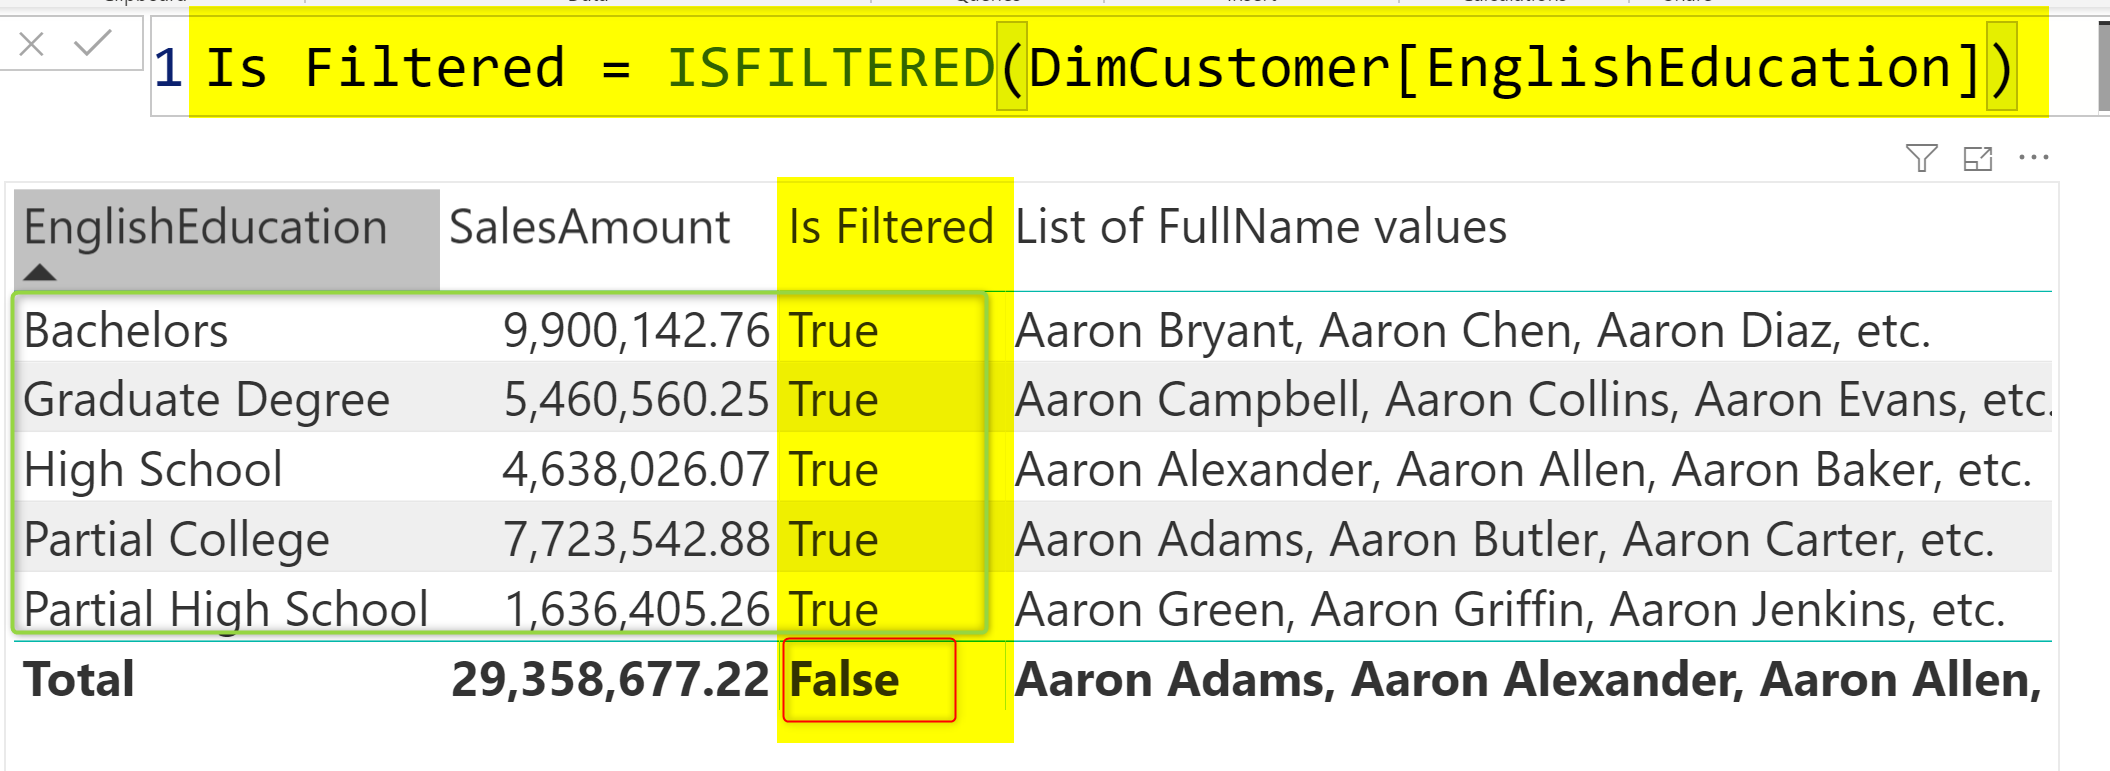
Because the table visual is filtered by the EnglishEducation field in the above screenshot, the ISFILTERED returns true for every row in the table. However, the total row is NOT Filtered by the EnglishEducation, and that means returning False.
The ISFILTERED function is very useful in many scenarios of writing DAX expressions. In our case, for removing the total value from a specific column, it can be used simply by using the field that filters all other fields. In my case, All I need is to check if the EnglishEducation is filtered or not and then use it in the measure calculation of “List of FullName values” (this measure is, by the way, a quick measure created by a concatenated list of values.)
Here is my changed version of the DAX expression with ISFILTERED in it;
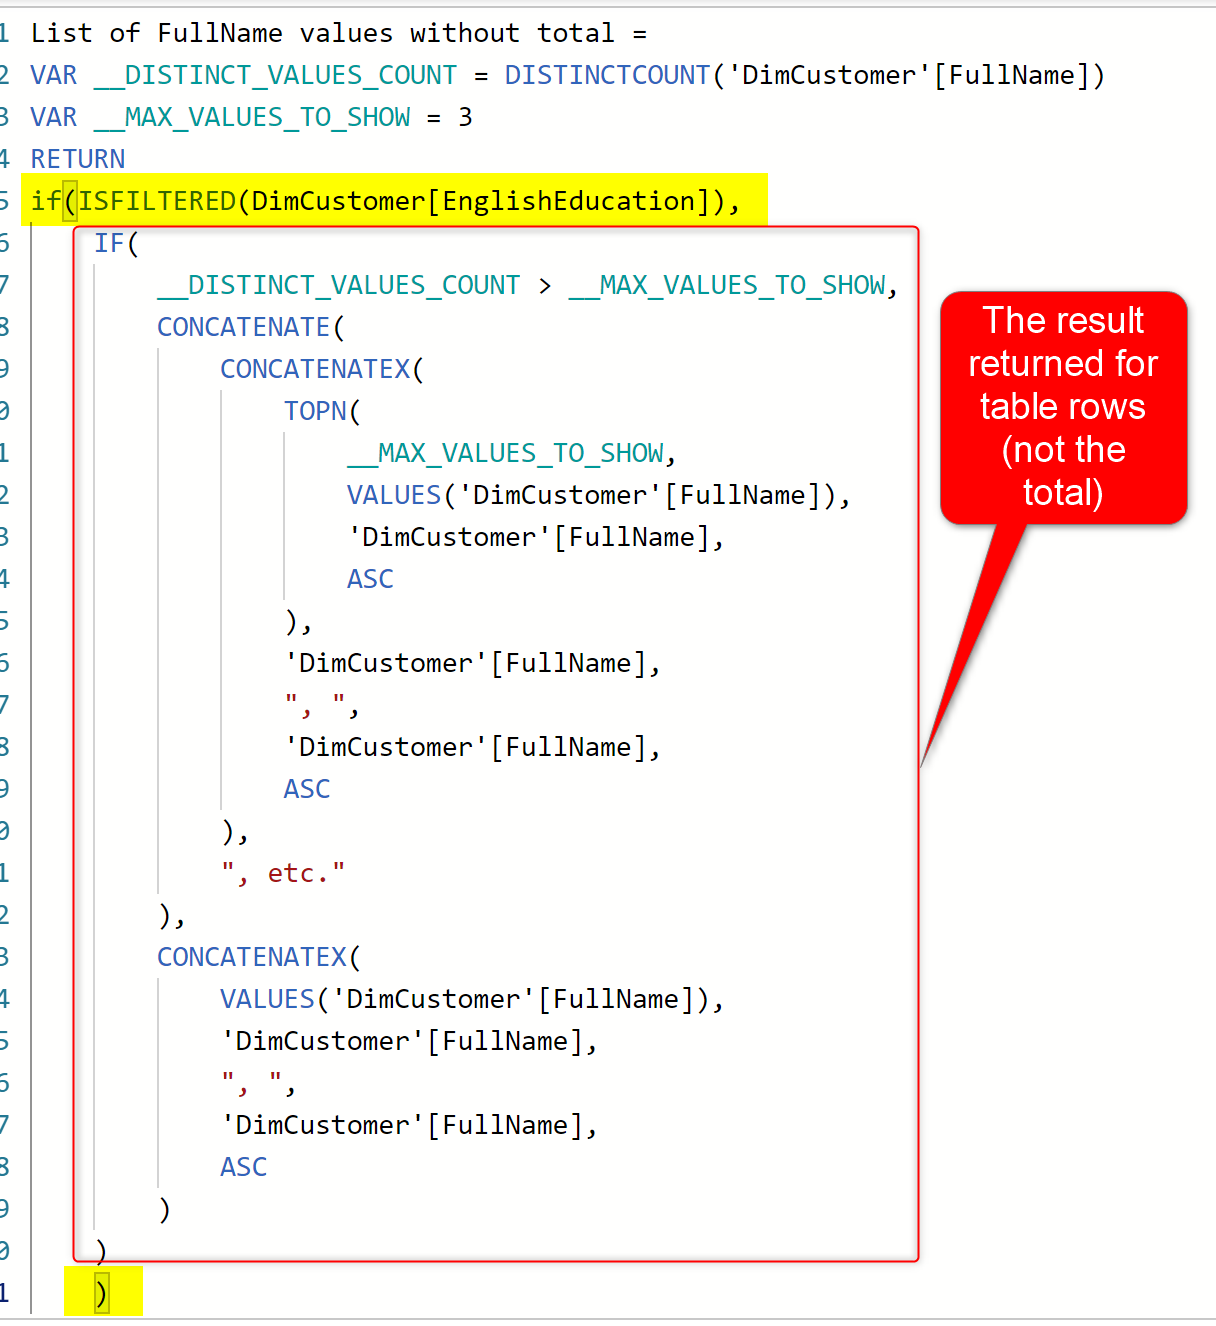
As you can see, I wrapped the measure’s value inside an IF statement like this:
IF(
ISFILTERED(
<column or table name>
),
<the result you want to show for the table rows - not the total>
)
This would give me something like this:
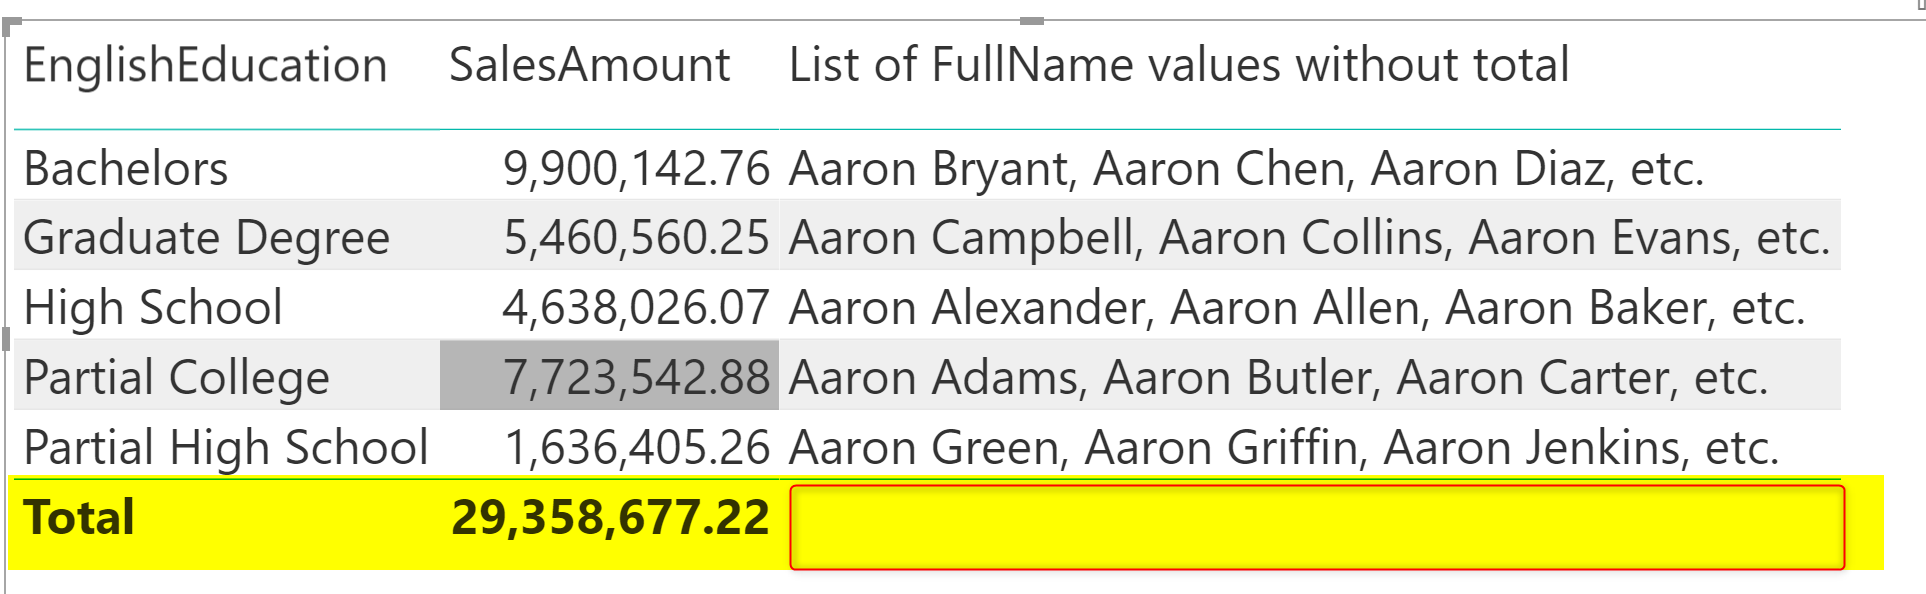
The above IF statement is only using the expression, and the what-if true, part of the IF. the what-if false part of it is not used, because it is optional, and when not provided, the default is blank.
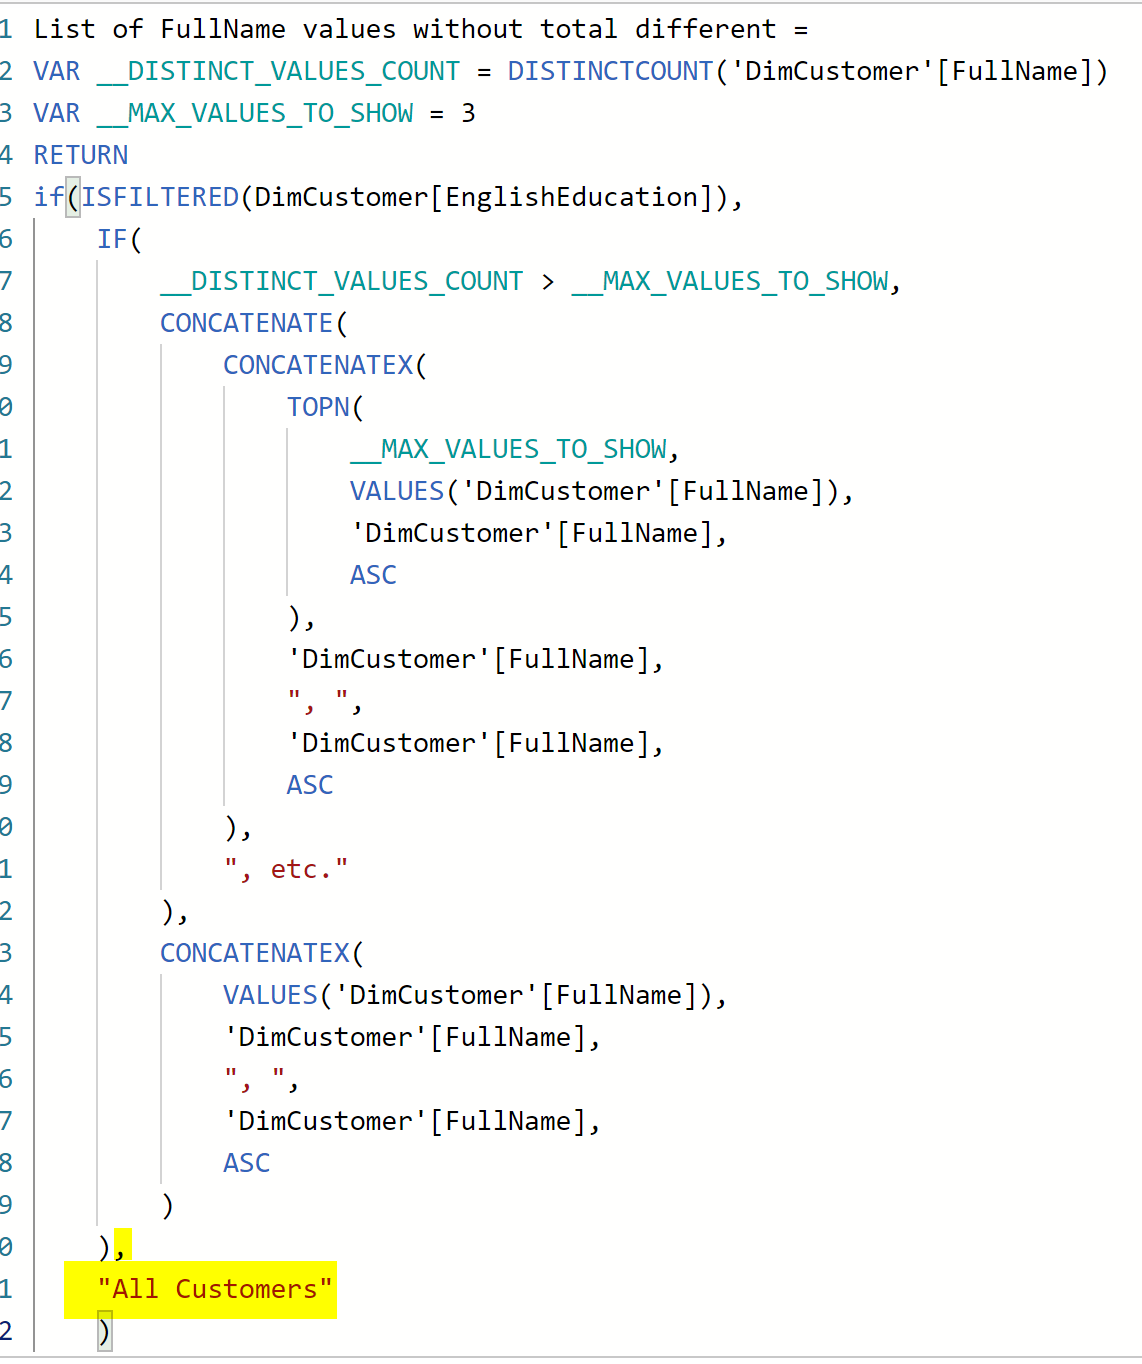
If you ever want to provide something else as the result for the total row, you can then use the what-if false part of the if statement like below;
IF(
ISFILTERED(
<column or table name>
),
<the result you want to show for the table rows - not the total>,
<the result you want to show for the total row only>
)
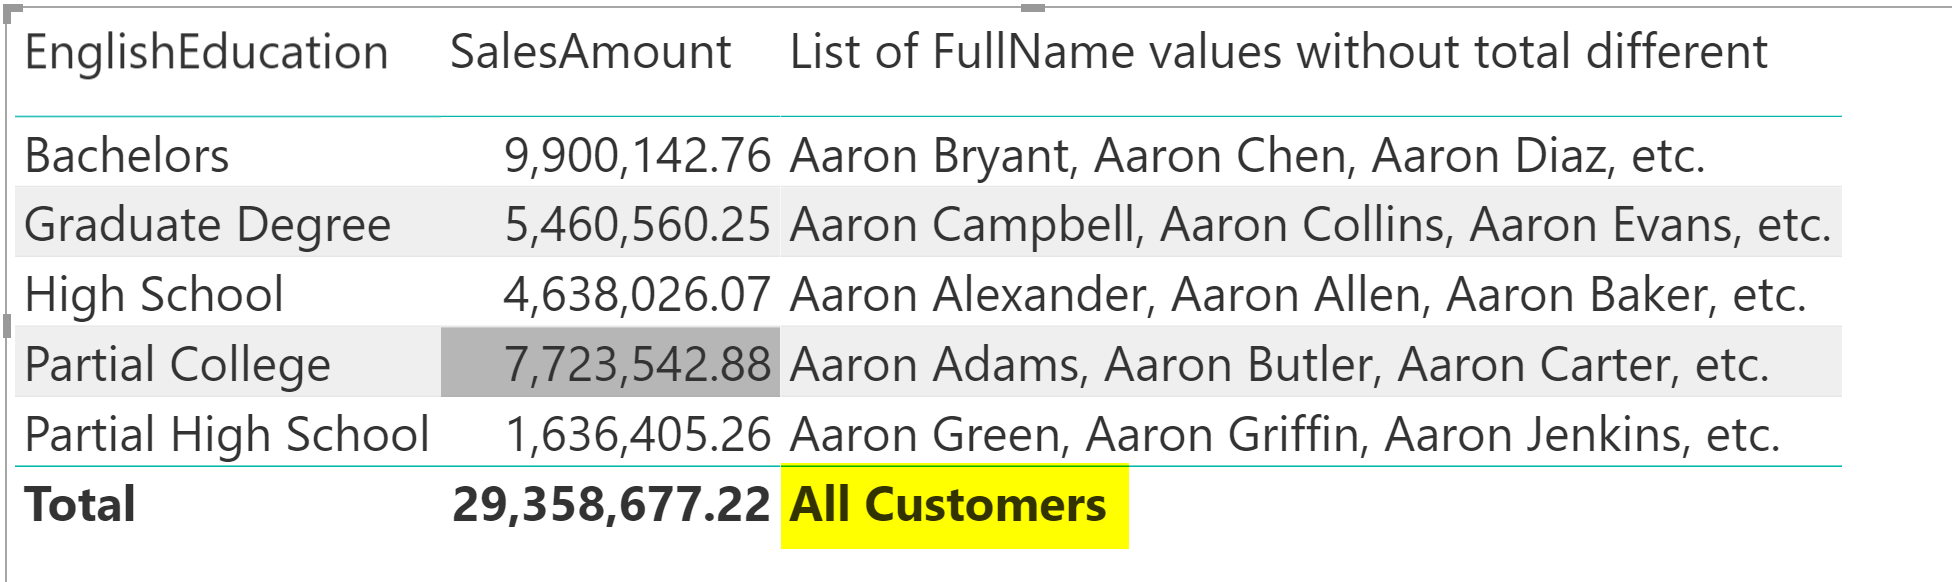
in my case, I change it to All Customer text;
And this is what the results look like now:
Formatting Visual Way; The Easy Way, but Limited
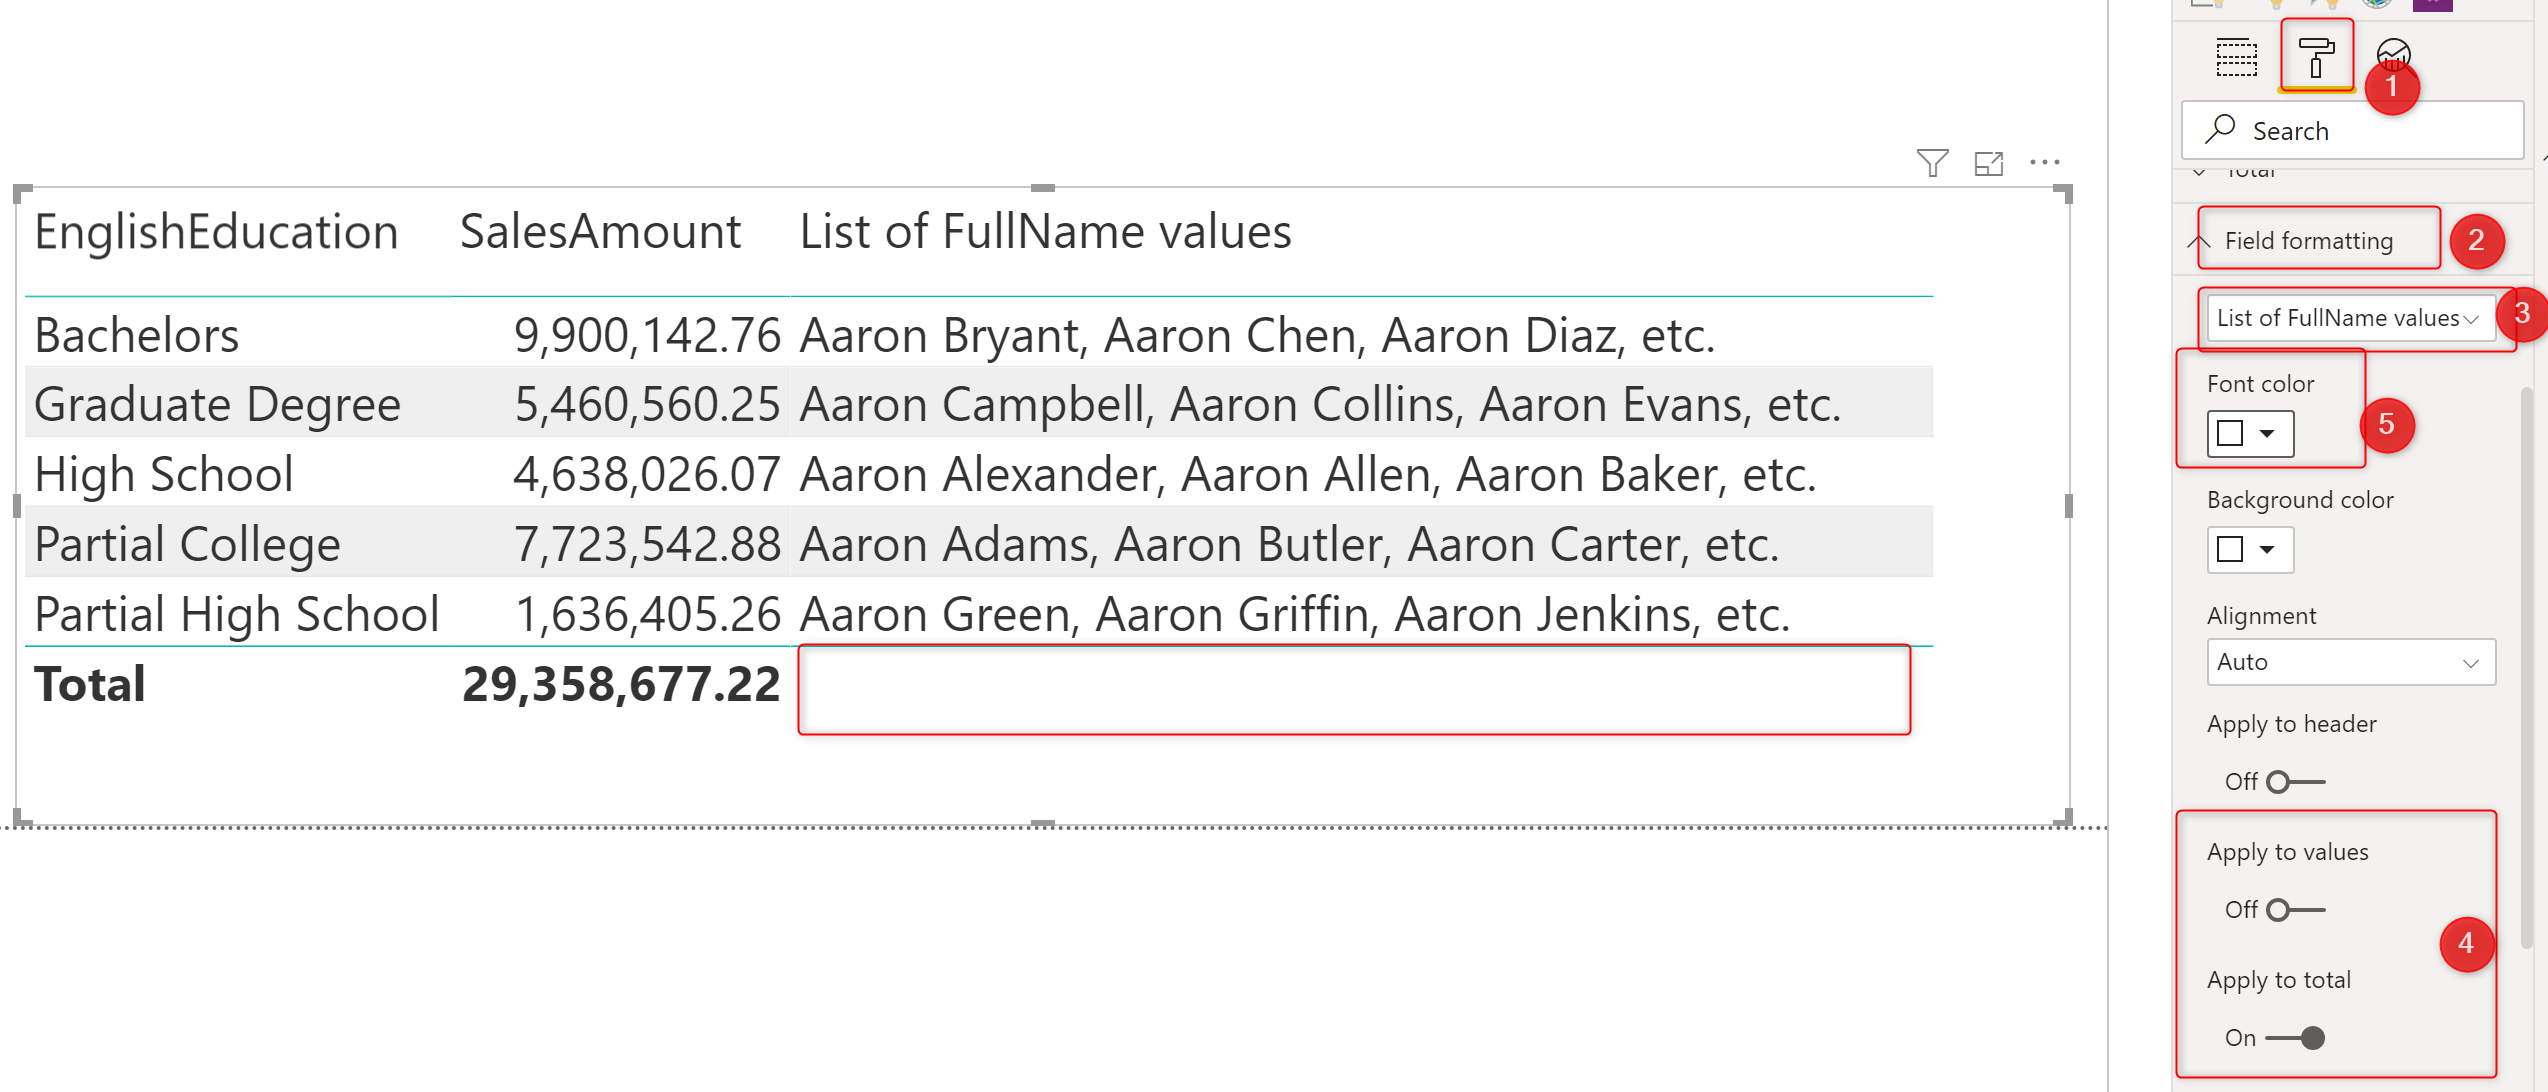
If you are just looking for removing the total for a specific column, and you don’t want to spend time fixing your DAX codes, there is an easier way. You can go to the Format tab of the visual, Under Field Formatting, select the field that you don’t want the total for it, and then make the below changes:
Set the Apply to values to Off, Apply to total to On, and then set the Font color to white (or something that makes the total looks blank)
This method of visual formatting is easier, However, it comes with caveats;
- If your Field values have specific formatting, then this formatting might change that.
- If you are using themes or any other background colors, you need to configure the Font color and Background color respective to that after every change in the theme.
- You cannot replace the total value with a different text or something like what you have seen in the DAX way of doing it.
Summary
I’m sure at some points, there will be an option in the table visual to turn off the total for each field. However, until that time, this might help you to do what you want. On the other hand, this helped you to understand how the ISFILTERED DAX function works, and use it in countless other scenarios in your Power BI solution.
Video


Reza is author of more than 14 books on Microsoft Business Intelligence, most of these books are published under Power BI category. Among these are books such as Power BI DAX Simplified, Pro Power BI Architecture, Power BI from Rookie to Rock Star, Power Query books series, Row-Level Security in Power BI and etc.
He is an International Speaker in Microsoft Ignite, Microsoft Business Applications Summit, Data Insight Summit, PASS Summit, SQL Saturday and SQL user groups. And He is a Microsoft Certified Trainer.
Reza’s passion is to help you find the best data solution, he is Data enthusiast.
His articles on different aspects of technologies, especially on MS BI, can be found on his blog: https://radacad.com/blog.
This is brilliant. Thank you for the insights.
Formatting Visual Way: is perfect for me.. Thanks