
Another aspect of sharing is the security of the dataset. Enabling different roles and giving users access to different levels of data is called Row Level Security. This post explains the details of this security method and how to configure it in Power BI Desktop. Row Level Security enables you to apply security to roles and adds users to each role. An example is helpful when you want people from one branch, city, department, or store to be able to only see their part of the data and not the whole data set. Power BI applies that through a row-level security configuration on the Power BI model itself. So regardless of what source you are importing your data from, you can apply row-level security on it. If you like to learn more about Power BI, read Power BI online book; from Rookie to Rock Star.
What’s Row Level Security in Power BI Desktop?
There are multiple levels in which you can secure the data in a Power BI Dataset. Row Level Security is about applying security on a data row level. For example, sales managers in the united states should only see data for the United States, not Europe. The sales Manager in Europe won’t be able to see sales in Australia or the United States. And someone from the board of directors can see everything. The reason was that Row Level Security wasn’t part of the Power BI model. Now in the new version of Power BI Desktop, the security configuration is part of the model and will be deployed with the model.
Prerequisite
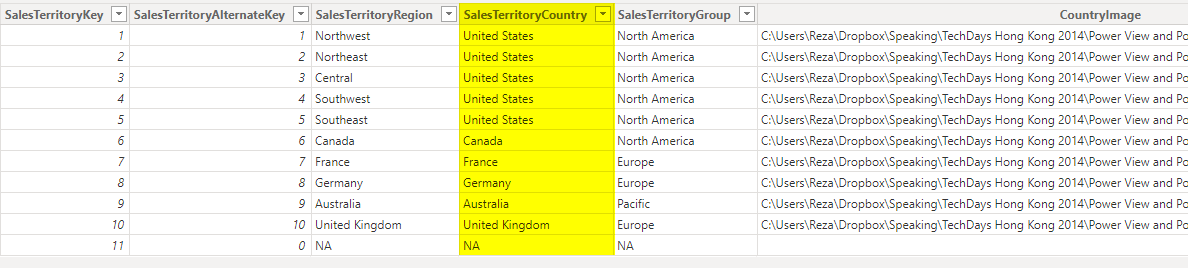
For this example, I will use AdventureWorksDW Excel sample data source. You can download it from here. There is a DimSalesTerritory in this dataset, with country details like below. This is the table which we will be using for applying security filters.
Create Sample Report
Let’s start with creating a sample Power BI desktop report from the AdventureWorks Excel file. I only select DimSalesTerritory, and FactResellerSales for this example;

without any changes in the Power Query editor, let’s load it in the report and build a simple column chart with Sales Amount (from FactResellerSales) and Country (from DimSalesTerritory). The chart shows sales amount by country, which can be used for creating row-level security on Geo-location information easily. Now let’s add one card visualization for the total Sales Amount. The below screenshot is the layout of this sample report now;
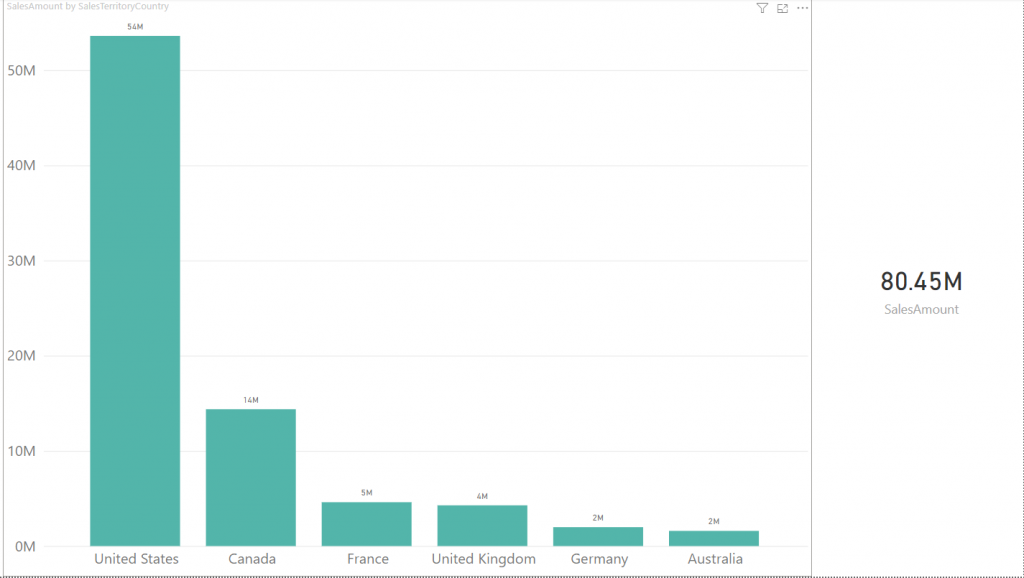
In this view, our total Reseller sales amount is $80M, and we have sales values for Australia, Canada, France, Germany, the UK, and the USA. Now let’s create roles.
Creating Roles
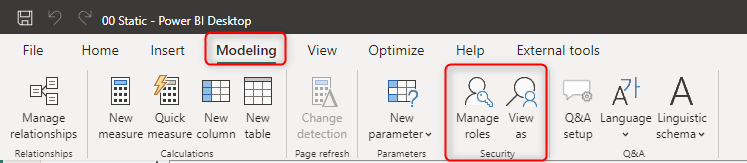
Now let’s create roles for that. Our goal is to build roles for sales managers in Australia and Canada. They should each only see their group or country in the data set. For creating roles go to the Modeling tab in Power BI Desktop. You will see a section named Security there;
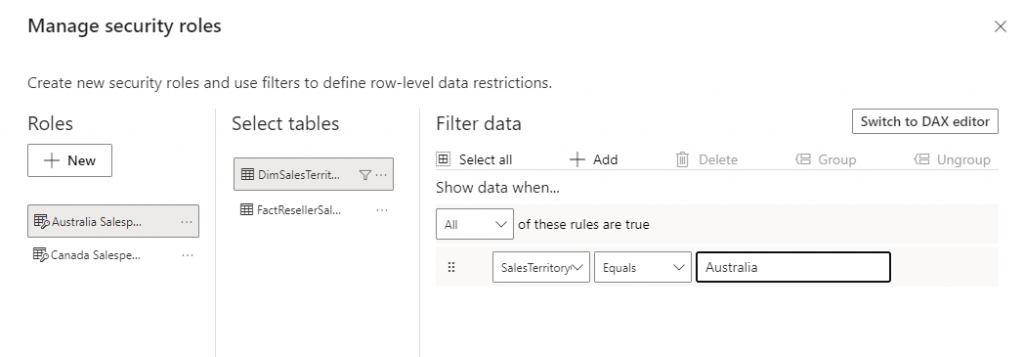
Click on Manage Roles to create a new role. You will see the Manage Roles window, which has three panes below.
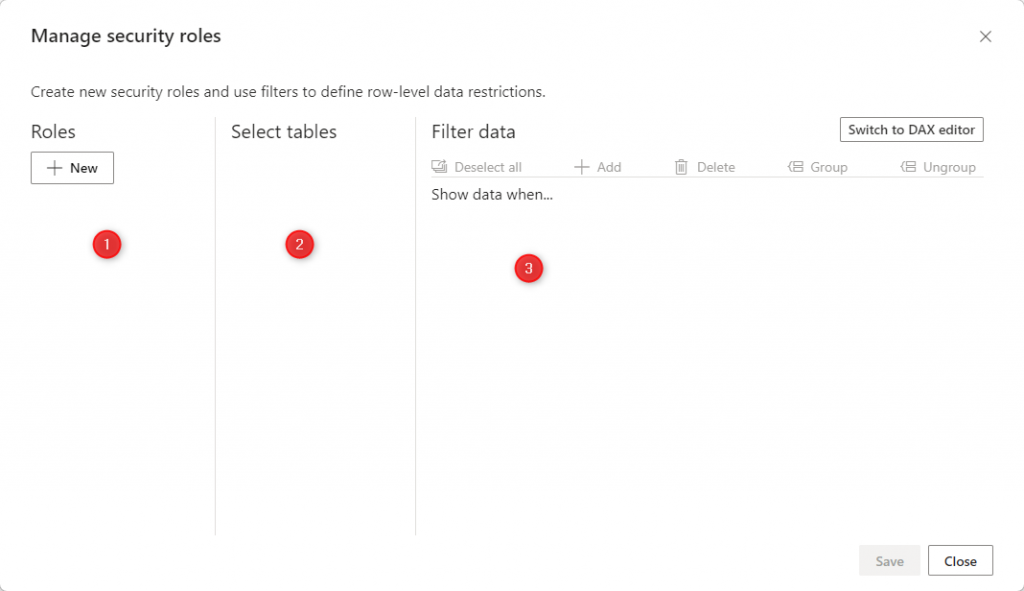
You can create or delete roles in numbered one pane, You can see tables in your model in numbered two pane (for this example, you will see two tables only, but not now, after creating the first role), and then you can write your DAX filtering expression in numbered three pane, or you can use the user-interface profited to define the filters.
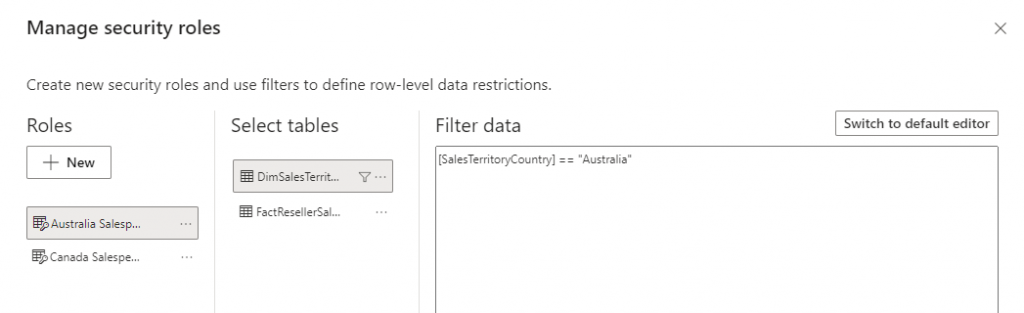
Now Create a Role, and name it “Australia Sales Manager” You will see two tables in the Tables section: FactResellerSales, and DimSalesTerritory. With a click on Add, you can add the rule you want for SalesTerritoryCountry Column.
You can also switch to DAX editor and see the DAX expression.
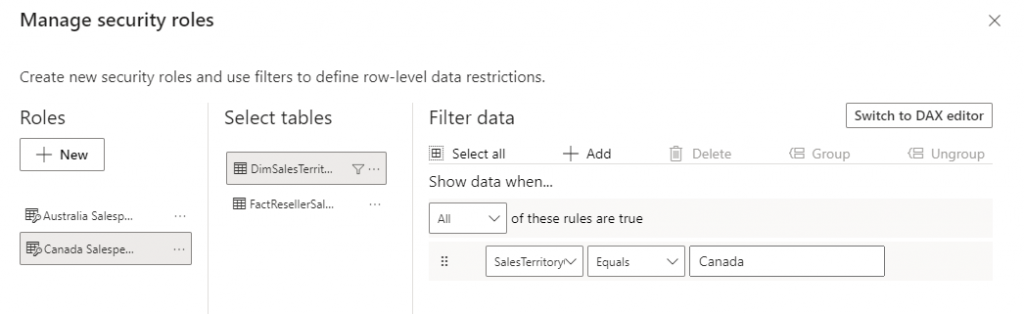
Now create another role, name it Canada Sales Manager, put a filter on SelesTerritoryGroup this time, and change Value to “Canada” as below;
Testing Roles in Desktop
Great, we have created our two sample roles. Now let’s test them here. We can test them in Power BI Desktop with View As Roles menu option. This option allows us to view the report exactly as the user with this role will see it. We can even combine multiple roles with seeing a consolidated view of a person who has multiple roles. Go to the Modeling tab, and choose View As Role option.
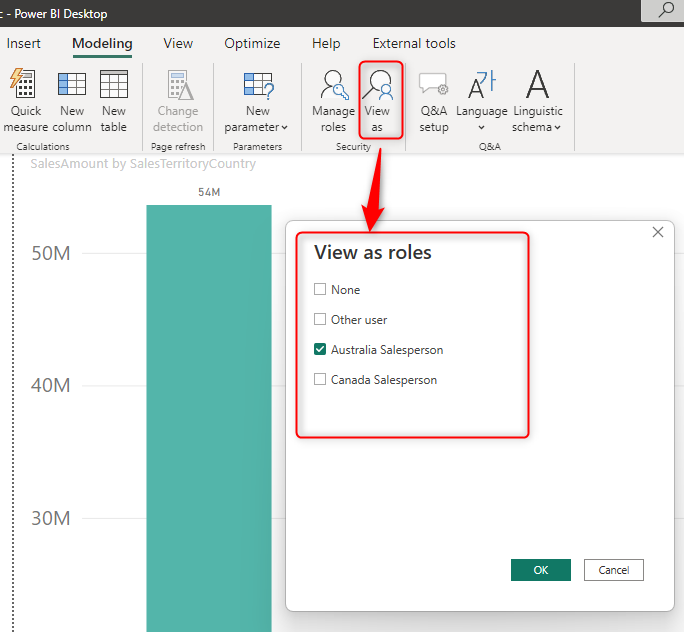
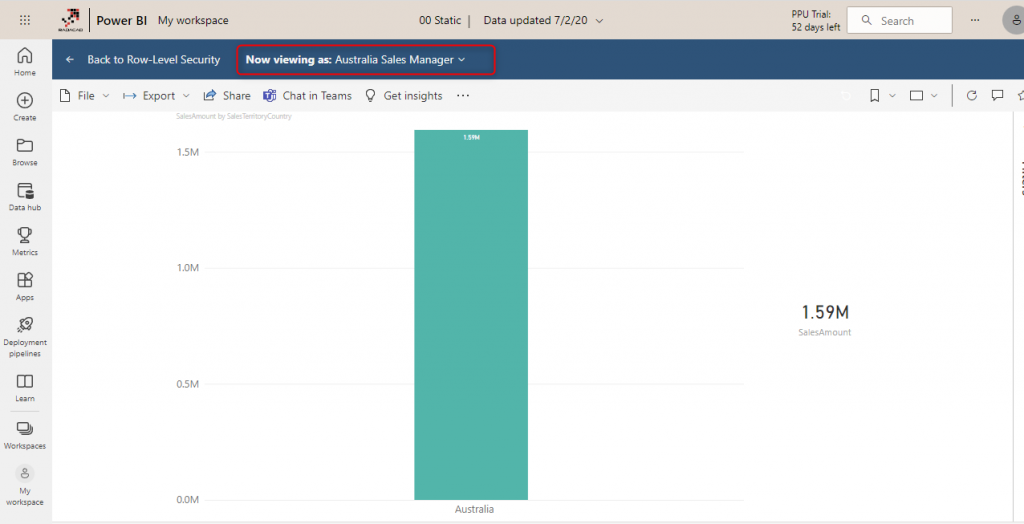
Choose Australia and Canada Sales Manager, and click on OK. You will see sales for Australia and Canada only showing with a total of $15.97M and only countries Australia and Canada.
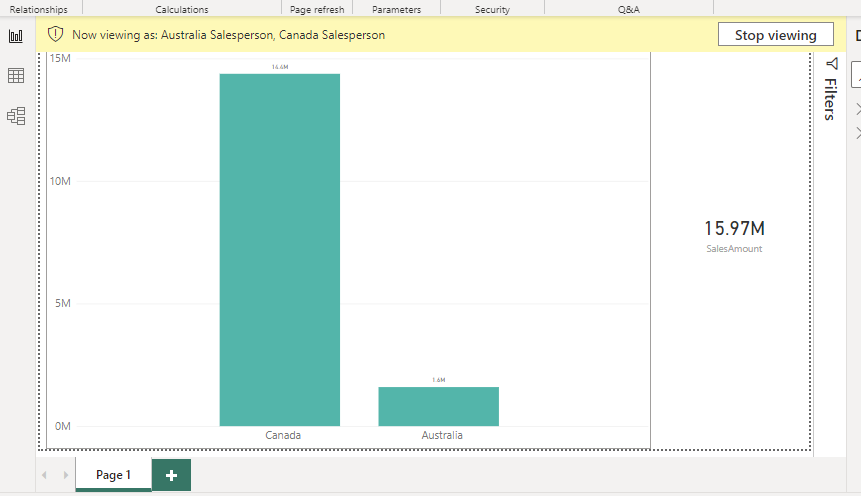
You can also see at the top of the report there is an information line highlighted showing that the view is Canada Sales Manager. If you click stop viewing, you will see the report as a normal view (total view).
Assigning Users to Roles in the Power BI Service
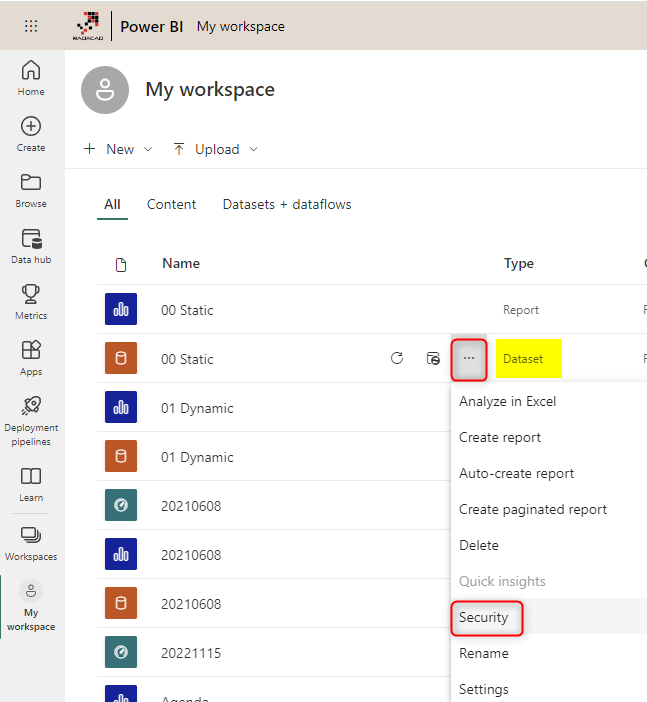
Roles should be assigned to Power BI users (or accounts, in other words), and this part should be done in Power BI Service. Save and publish the report into Power BI. I named this report 00 Static. You can name it whatever you want. After publishing the report, click on Security for the data set.
Here you can see roles and assign them to Power BI accounts in your organization.
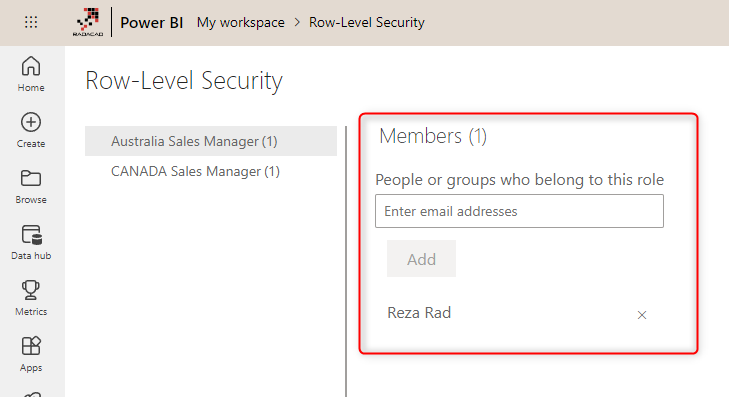
You can set each user to more than one role, and the user will then have a consolidated view of both roles. For example, a user with both roles for the Australia and Canada sales manager will see data from Australia and Canada.
Test Roles in Power BI Service
You can also test each role here. Just click on the ellipsis button beside each role, and click on Test as Role.
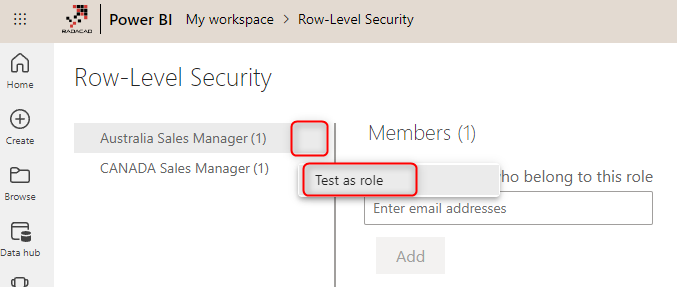
Test As Role will show you the report in view mode for that role. The blue bar shows that the report showed the role of Europe Sales Manager. You can change it there if you like.
Setting users for each role makes your row-level security ready to work. If the user login with their account, they will only see data for their roles.
Re-Publish Won’t Hurt
As I mentioned in the very first paragraph of this chapter, the great thing about this new feature is that RLS is part of the Power BI model. And if you publish your Power BI model repeatedly with changes, you won’t lose configuration on the web. You also won’t lose users assigned to each role if you keep role names unchanged.
Summary
Row Level Security gives users different views of the data from the same Power BI content. As you have learned in this chapter, implementing row-level security is simple. This method is called ROW level security because of the DAX filter applied on the data row level.
In this article, you’ve learned about a specific type of row-level security called Static row level security. It is called static because the filter values are statically determined in DAX expressions. Maintenance costs are very high if you want to apply such a filter for thousands of roles. In an ideal world, you want to apply security based on users’ login automatically. In the next article, you will learn about Dynamic Row Level Security which is the next step in applying security in more complex scenarios.
Video


Reza is author of more than 14 books on Microsoft Business Intelligence, most of these books are published under Power BI category. Among these are books such as Power BI DAX Simplified, Pro Power BI Architecture, Power BI from Rookie to Rock Star, Power Query books series, Row-Level Security in Power BI and etc.
He is an International Speaker in Microsoft Ignite, Microsoft Business Applications Summit, Data Insight Summit, PASS Summit, SQL Saturday and SQL user groups. And He is a Microsoft Certified Trainer.
Reza’s passion is to help you find the best data solution, he is Data enthusiast.
His articles on different aspects of technologies, especially on MS BI, can be found on his blog: https://radacad.com/blog.
Thank you for the post, it answered a few questions I had regarding the new updates of rls.
Thanks Mark for your kind words. I’m glad it helped.
Cheers, Reza
Have you worked on any models where RLS can be applied to ‘inactive’ relationships? I am using the ‘UseRelationship’ formula in DAX to create measure for our sales team. The theory being the main relationship is the actual sales they are credited for versus the sales their territory is credited for. For example, a sales member starting in 2017 wants to see his personal production, but also be able to toggle to see his territory’s historical production.
Hi Brad.
I would rather to change the inactive relationship to a role playing dimension. In that case you can easily use RLS, and you won’t need to bring UseRelationship in your DAX formula. I have written a blog post about how to use Calculated Tables for role playing dimension.
Cheers
Reza
This is very useful info for me as a rookie for Power BI.
Just one quick question on this RLS. We are a big organization and have various active directory and users can be in more than one. Is there any way I can mass assign users to each Role so i don’t have to keep up with myself?
If you want to follow the roles that you already have in AD. then I suggest you do have a look at Dynamic RLS, and patterns of that such as Users and profiles. I wrote about both of them here:
Dynamic RLS
Users and Profiles
Cheers
Reza
thanks a lot
Thanks a lot for this simple and very useful tutorial.
Cheers
Hi Reza,
I have applied RLS and it is working fine in Power BI service. But when a user export data in excel he is getting all information instead of only relevant data.
Thanks,
Nirmalya Roy
Hi
I just checked this.
The user would see only his/her own data even after export data to excel. If you see different behaviour, then the access might be somewhere defined differently. I’d check the access to the dataset, the report, the role definition, if in a workspace, access to those etc.
Cheers
Reza
Hi Reza,
Thank you very much for posting, That’s exactly I am looking for. Can I ask a question?
I created 3 roles: Manger, Supervisor, and worker,
the rows in the report will be :None, Manager, Supervisor, and worker.
Manager should see all rows, Supervisor should see None+Supervisor+worker, Worker should see None+worker,
How to set up/control the None part in Web?
Many thanks,
Linda
Hi Linda.
Does None mean the user will see nothing? or their own data?
Cheers
Reza
Reza, thank you for the post. But I’m not getting this to work for me. I am a rookie PBI’er and having trouble with troubleshooting my problem. The View as Roles works. Test as in Service works, but my users are getting ALL the data, not just what they are prescribed to get. Are there troubleshooting resources, i.e. a book “all things row level security”? 😉 I don’t think Dynamic RLS is what I’m looking for, as the user account information is not in my data. My data contains a numeric organizational code and I am assigning a user to that code via RLS. The user still sees entire institution data in service.
Hi Terri
How did you share the report with users? if they have edit access, then they will see everything regardless of RLS.
for example, if you publish the report in a workspace and they have edit access to the workspace. they would see everything. but if you create an app on top of the workspace, through the app, they should see only their own data.
Cheers
Reza
Hi Reza, this is very useful. however, if i would like to have two countries in one role, would it be possible? What the Dax i should put in. Thankyou.
You can simply write a dax statement such as
Country IN {“Australia”,”New Zealand”}
Hi Reza, this post and video are super helpful.. I have one doubt though.. In RLS step in power bi service should other users must have power bi account? because I want to render report in my application for non-power bi users.. Looking forward for your response..
Hi Reza, the RLS seems not to be working for other access categories except “Viewers” in WORKSPACE. I need to publish my report to APPs and still retain the RLS settings but that seems not to be working except if you are giving Viewer access on the workspace.
The RLS works for any user who do NOT have EDIT rights on the content. which means Viewer access to the workspace, and all the power bi APP users. you should be able to share this through App, and users will see the data they are authorized to see, unless you give them more permission.
Cheers
Reza
can i manage roles like this, but for users who access to my reports using the app? thank you
If you are sharing through Power BI Apps, users will see it based on row-level security setup, and the content will be restricted for them correctly.
Cheers
Reza
Please help me with this scenario for RLS:
* The dashboard will be open to everyone in the company.
* The default display property for Dispatcher and Tech will be to see their name on any order where it applies,
otherwise they will see the word “Other”.
* Three special AD roles will be set up. They will allow:
* Ability to see all Dispatcher names
* Ability to see all Tech names
* Ability to see both all Dispatcher names and all Tech names
Hi Supriya
what you are after is data masking rather than row-level security only. check out my article about it here.
Cheers
Reza