
There is a possibility to run R codes and Python in Azure ML. In this short post, I am going to show you how we can run an R codes to show some charts in Azure ML with ggplot2 package.
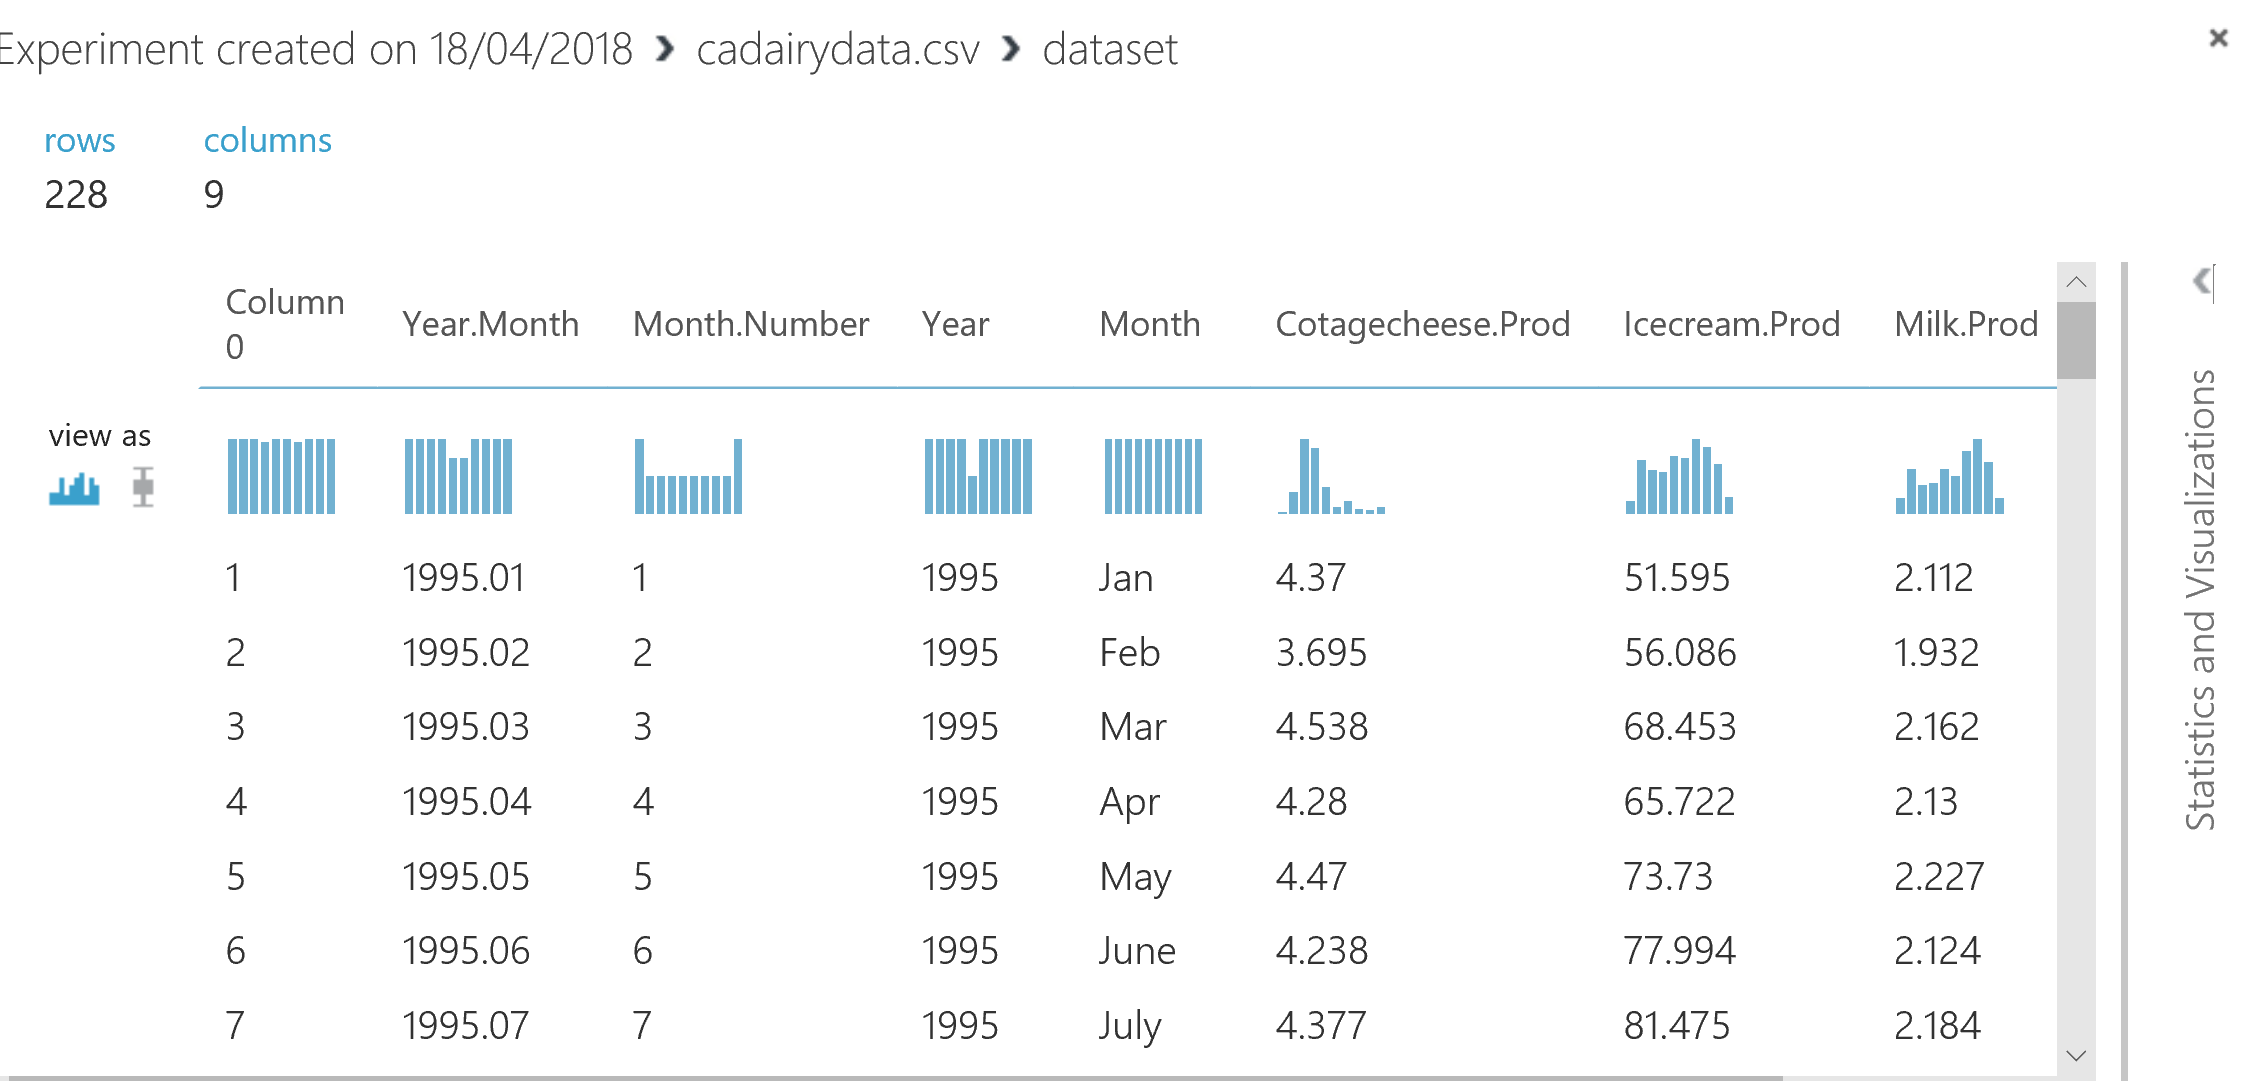
I have a dataset about the dairy product in the USA. this dataset holds data about the cheese, milk, and ice cream production. I want to show the statistical summary of data by drawing box plot to show the min, max, median, 1 quarter, and 3rd quarter of milk production based on the month number and the year.
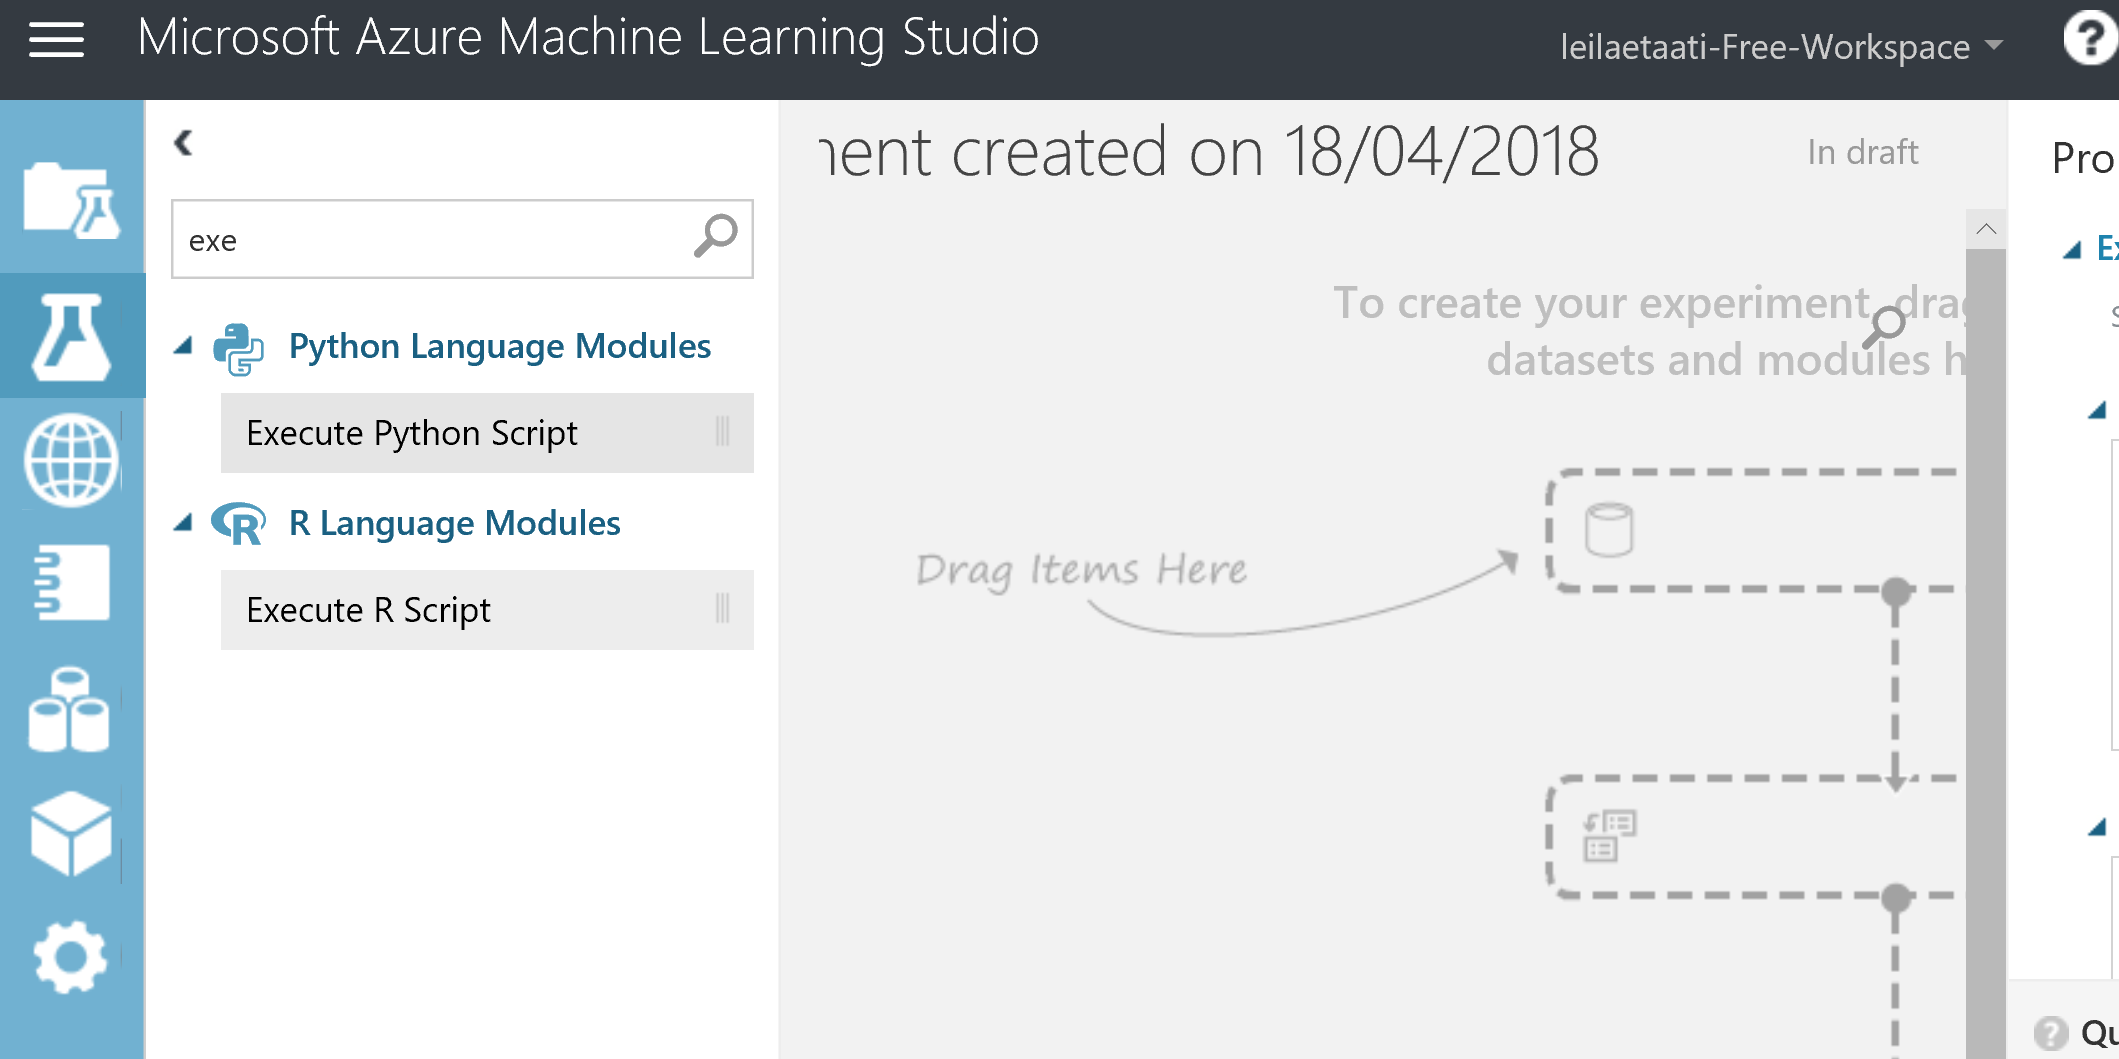
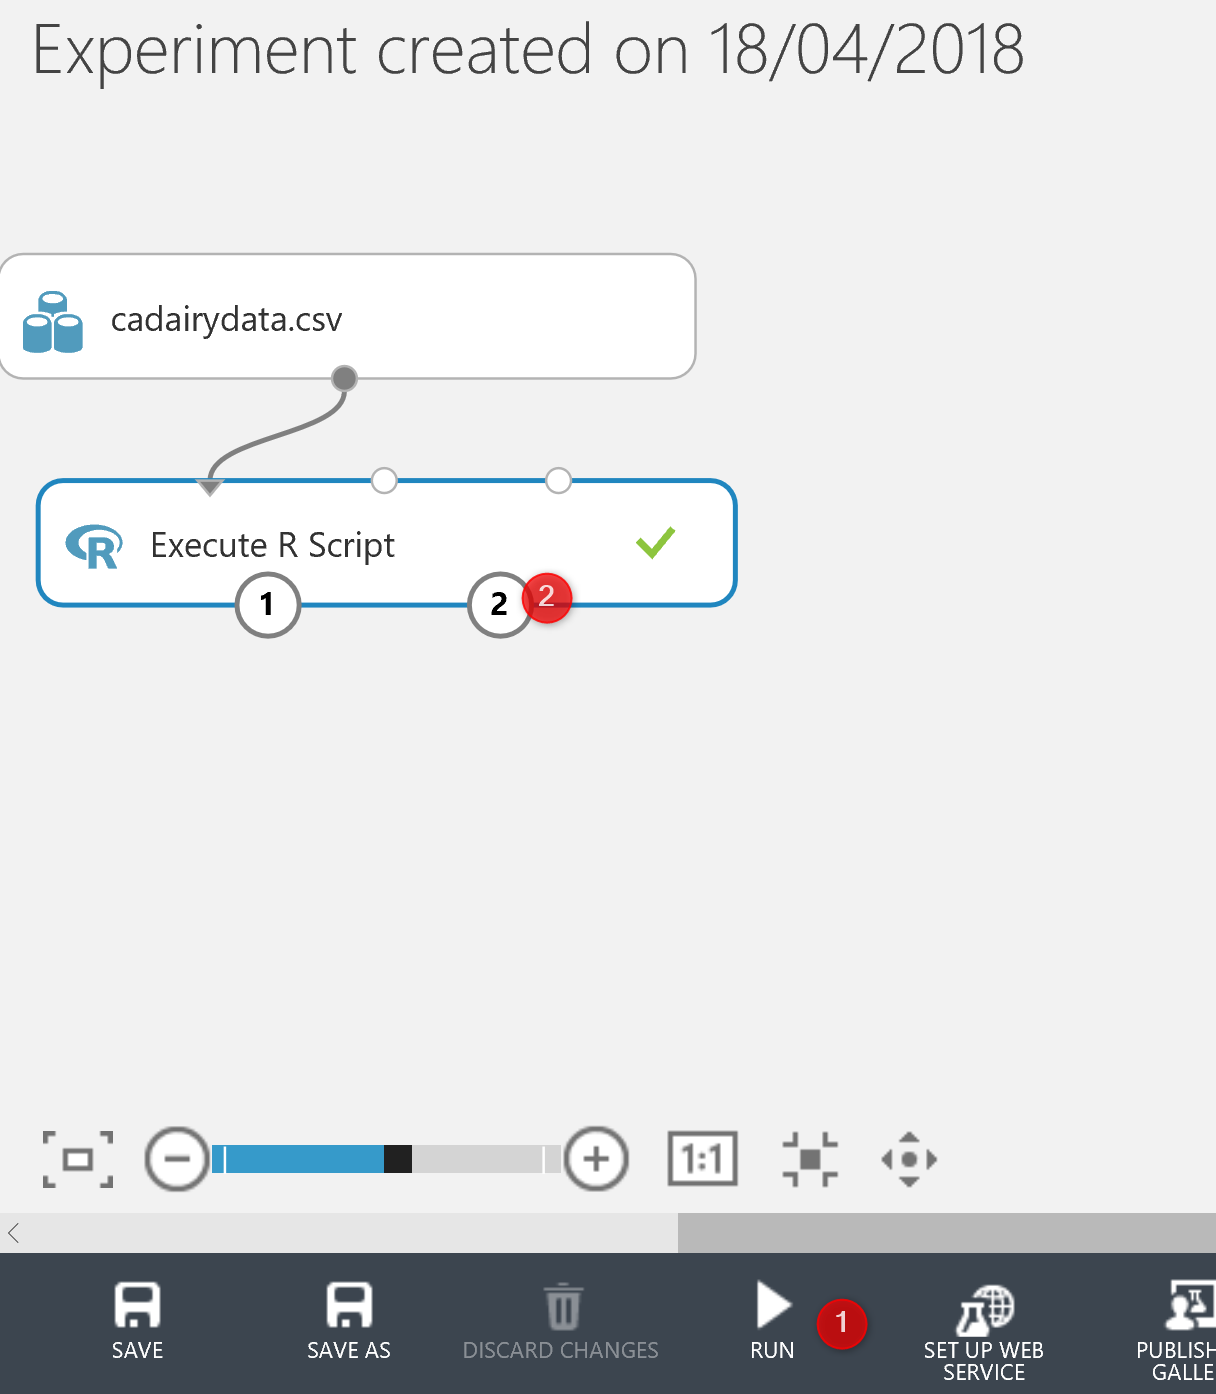
There are two nodes in Azure ML studio name “Execute Python and R scripts”, as you can see in the below image.
the dataset about milk production in the USA has been shown in the below image.
I drag and drop the milk dataset into Azure ML environment. Then, I added a node for “Executing R scripts”. This node has an editor to write the R codes.
the first statement is about getting the data from the first input node (maml.mapinputport). “Execute R scripts” able to get three different nodes. to access each node, we can change the number for “mapInputPort(1)” or 2 or 3.
I stored the data collected from the first node in dataset1. I refer to “ggplot2” package by using “library(ggplot2)”. T0 draw boxplot, a ggplot function has been used.
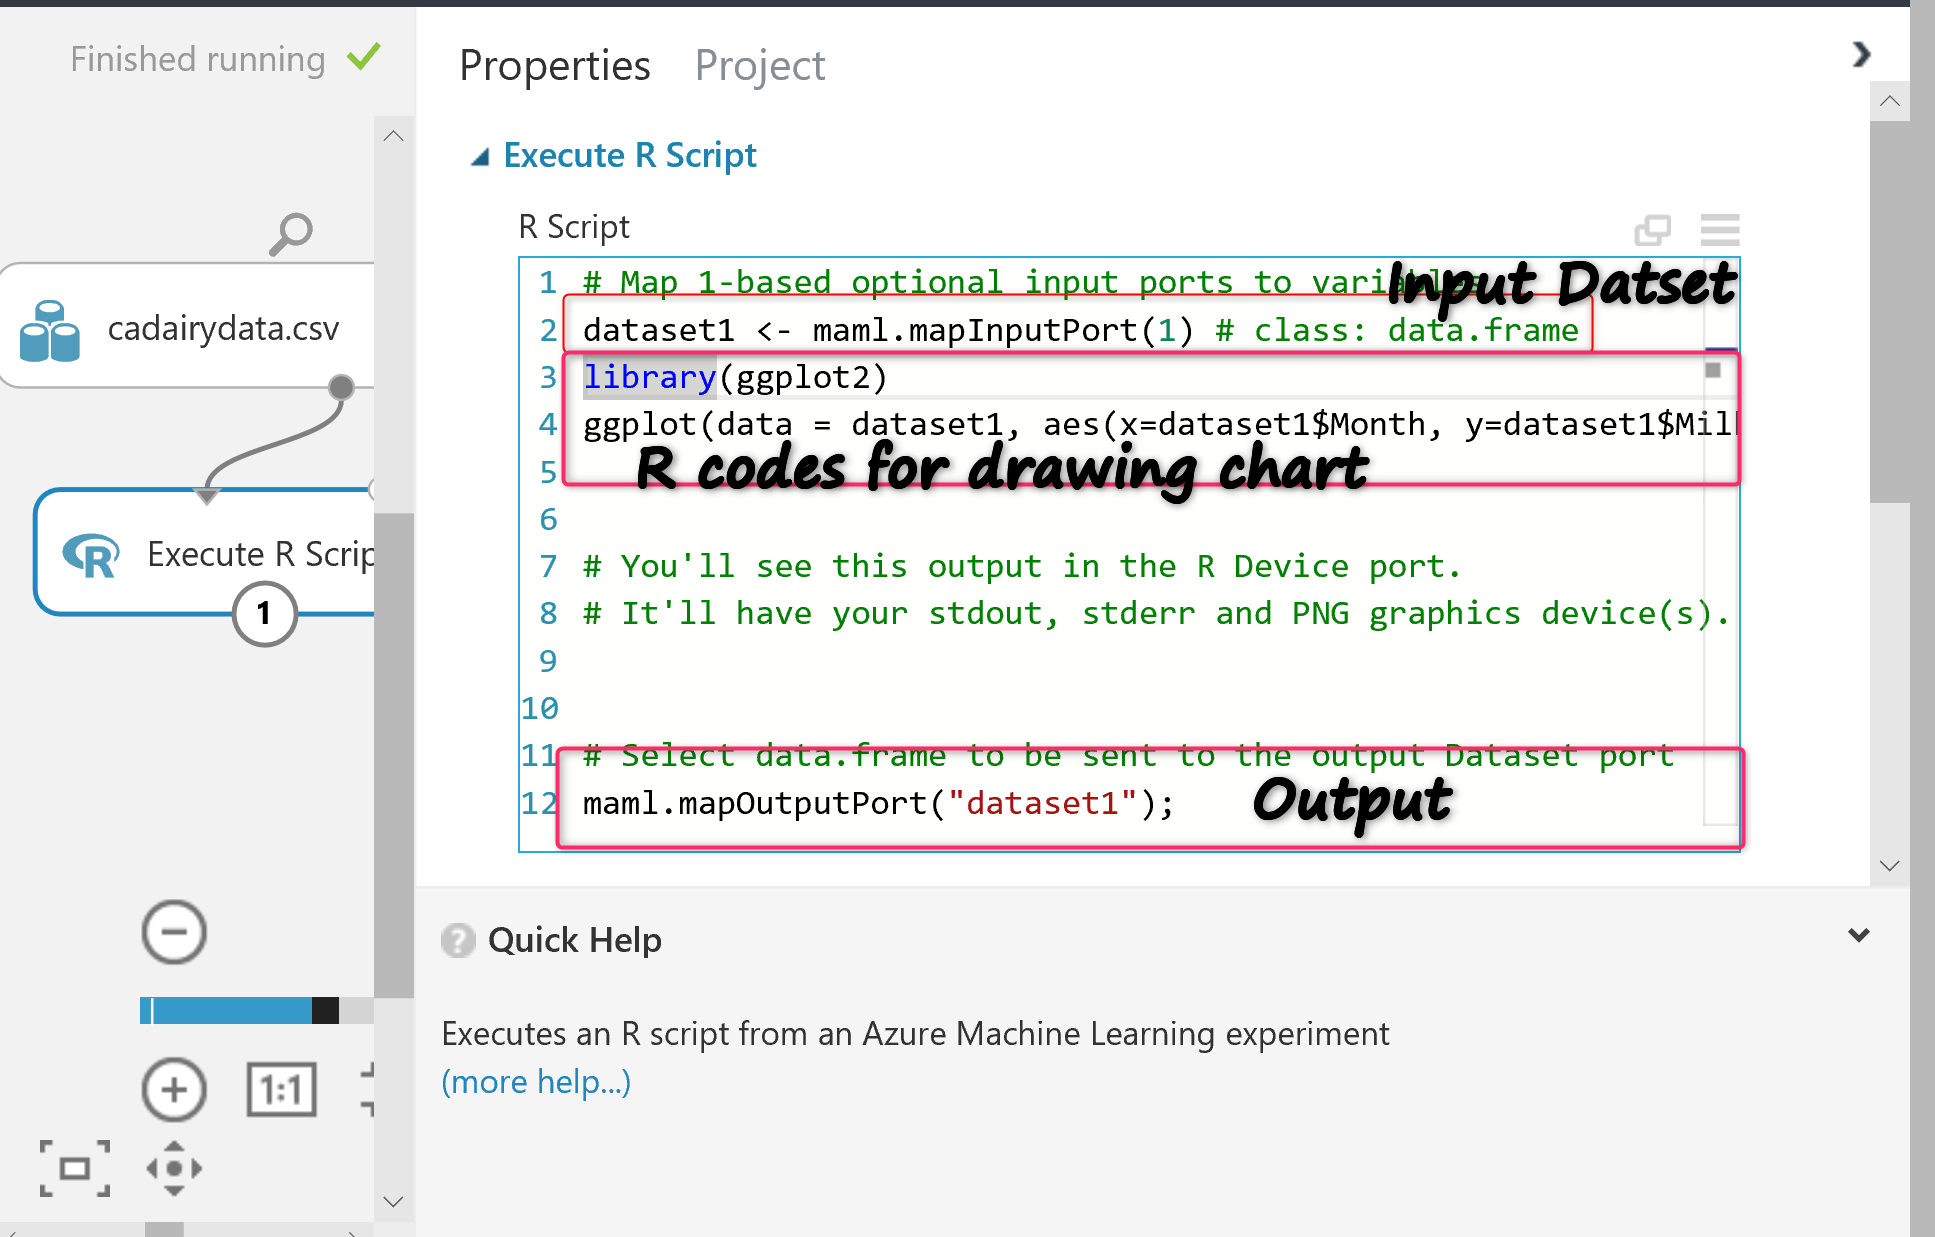
As you can see in the above picture, to show the original dataset in output node(the first in the left), mapOutputPort.
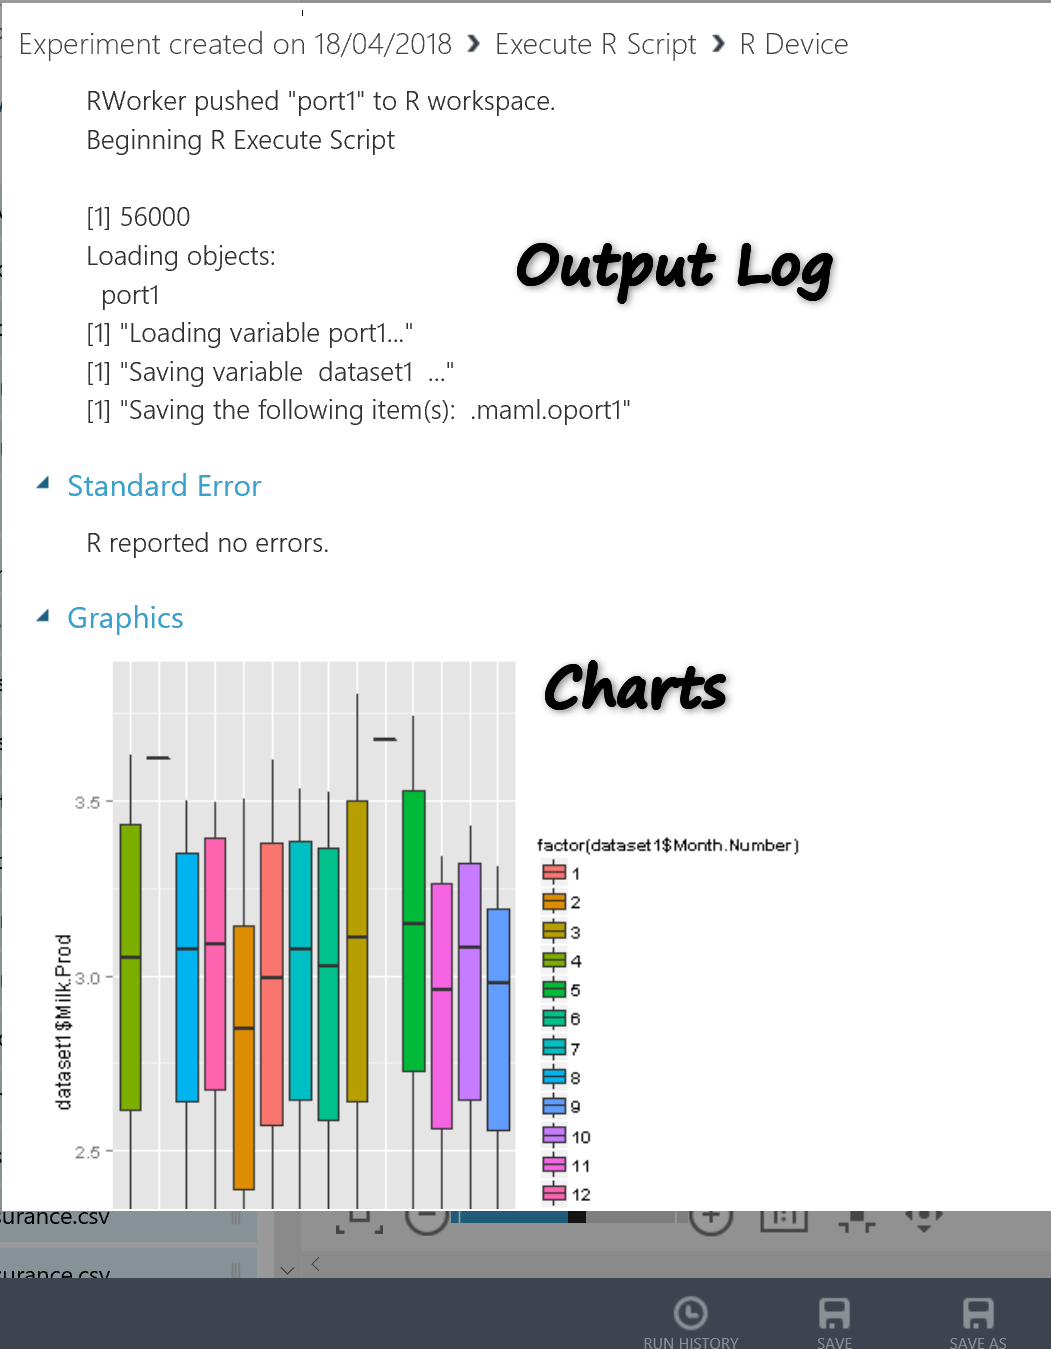
We need to run the experiment and check the output node 2 to see the result of the run. the output node in the right shows the box plot chart related to the Milk production.
Moreover, you able to see the output log of running the R codes.


