
For a visualization tool, one of the important factors is to filter the data for a specific reporting requirement. Power BI gives you this ability by the Filters pane in the visualization. There are, however, three scopes of filtering, which you need to be aware of. In this short article and video, I explained how they work and what is their difference.
Video
Filters pane
Filters can be applied in the Filters pane in Power BI Desktop (or Power BI service) on the visuals of the report. In earlier versions of Power BI Desktop, the Filters area was an area under the visualization section, but these days, it has a separate pane for itself.
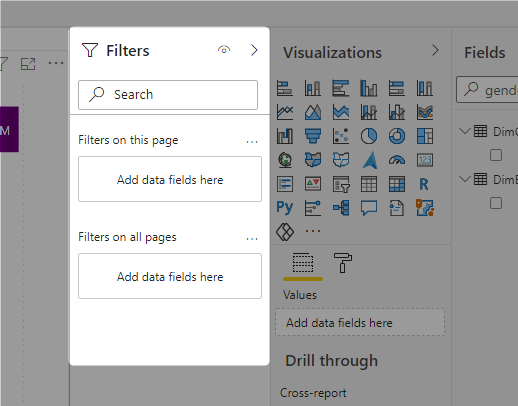
This is the place that you can define all the filters for your visualization elements. These filters may or may not be visible for the users (depends on your configuration). Filters can be applied in three levels, or three scopes mentioned as below.
Visual-Level Filter: Only current visual
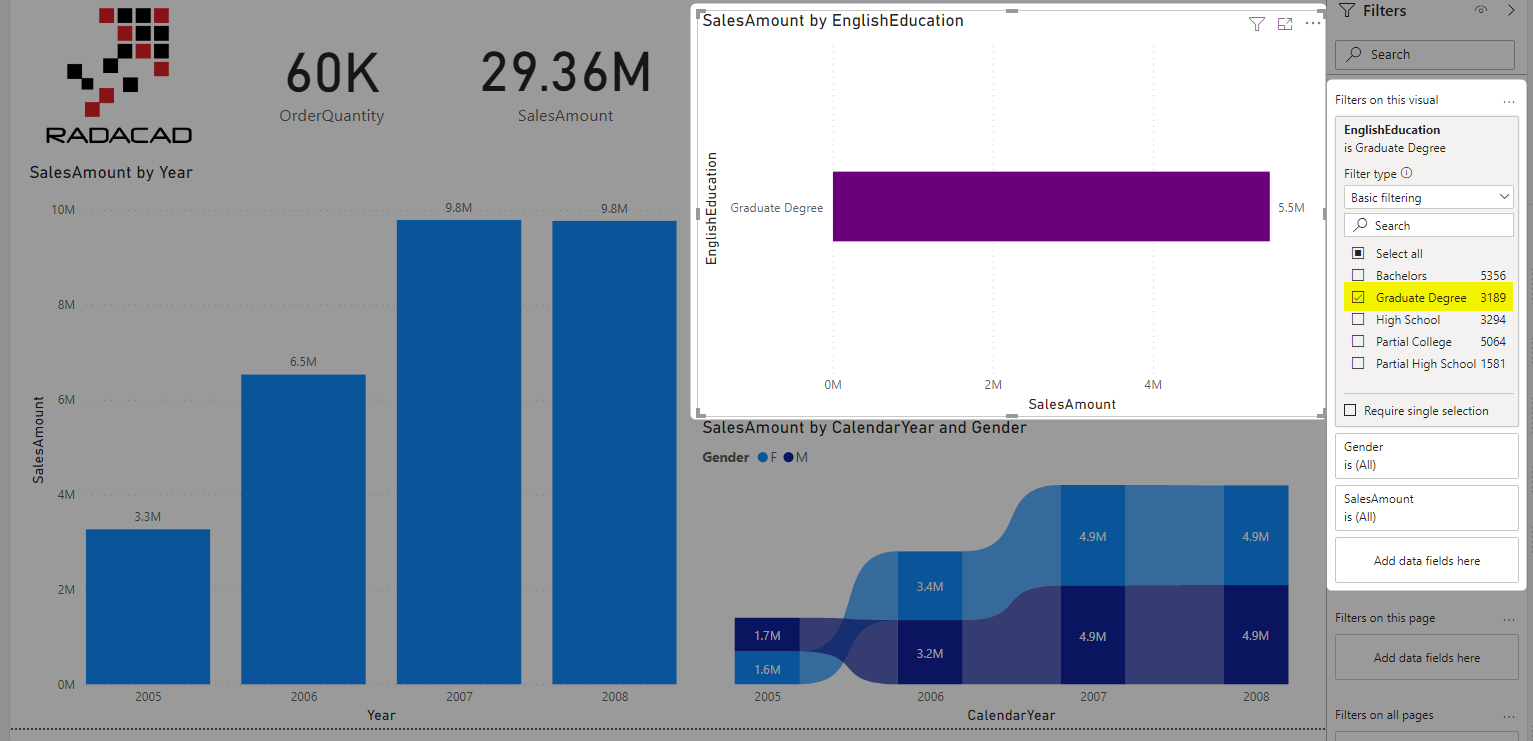
If you want to apply a filter on a specific visual only, then you have to click on the visual. After clicking on that visual, you will see the Filters pane has a section for Filters in this visual.

By default, you will see the fields used in that visual under this section (in the example above both EnglishEducation and SalesAmount are fields used in the bar chart). You can change the filter condition for any of those, or add another field to the filters section by dragging it to the “Add data fields here”.
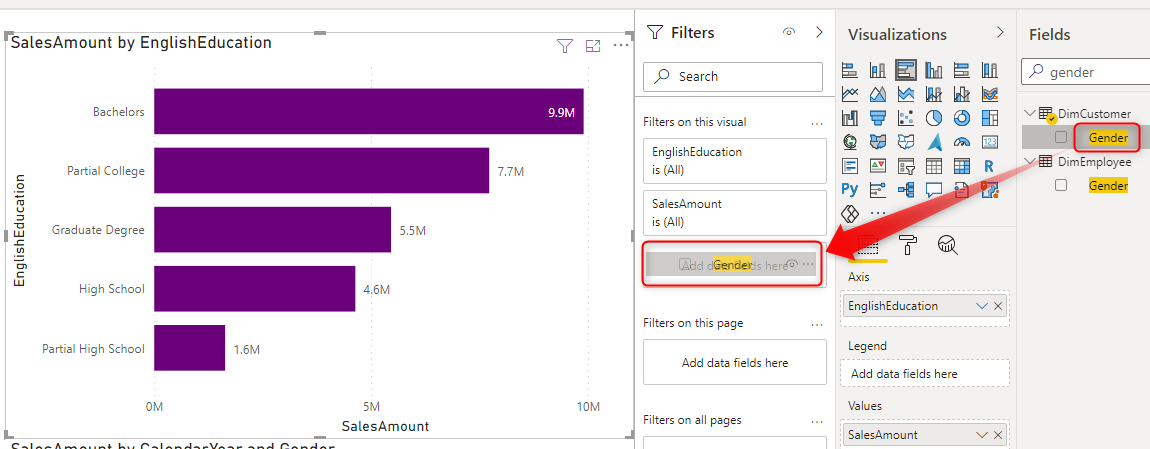
Depends on the type of the field, you can apply the filter. Any filter applied in here, will only affect on this visual, but not other visuals in the page.
Page-Level Filter: All visuals on the current page
If you want to apply filters on all the visual in the page, it is much easier to set the “Filters on this page”. Using this option. all the visuals in that page will get filtered.
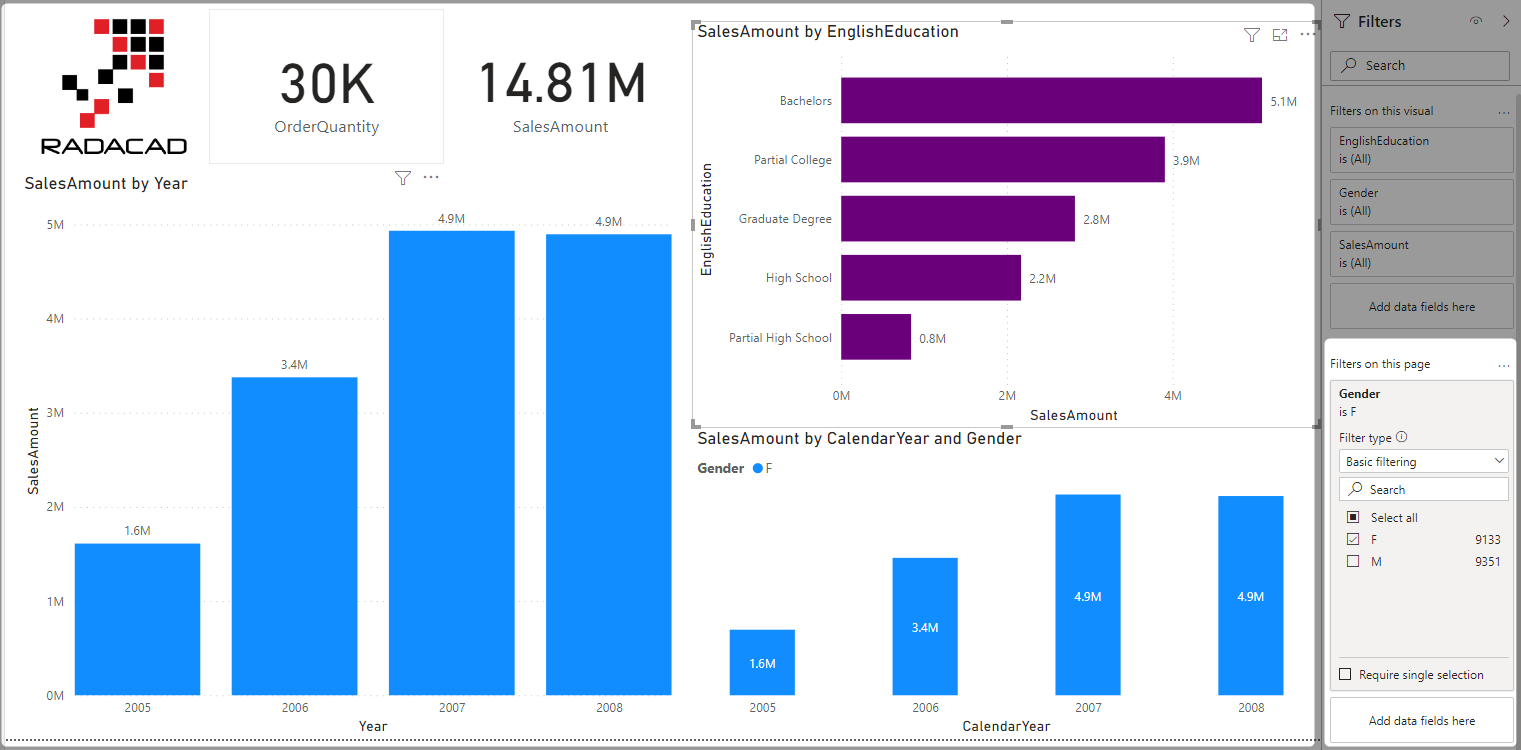
unlike the visual level filter, there is no field in the page level filter by default. You have to drag and drop fields into this area to start filtering. Filters applied here will not apply on other pages, they only effect this current page.
Report Level Filter: All visuals on all pages
The most wide range of filter to be applied is the filter you apply on all pages. This will filter all the visuals in all pages of the current report (meaning the current *.PBIX file).
As you can see in the example above, the filter applied on “all pages” simply filters all the visuals in both pages of the sample report.
How to know what is filtered?
A question I get commonly asked in my courses is that; “once the data is filtered, how do we know what is filtered? especially for the users it is important to know that”. The good news is that Power BI has an option to show you what is filtered, when you hover the mouse on the little filter icon on top of every visual;
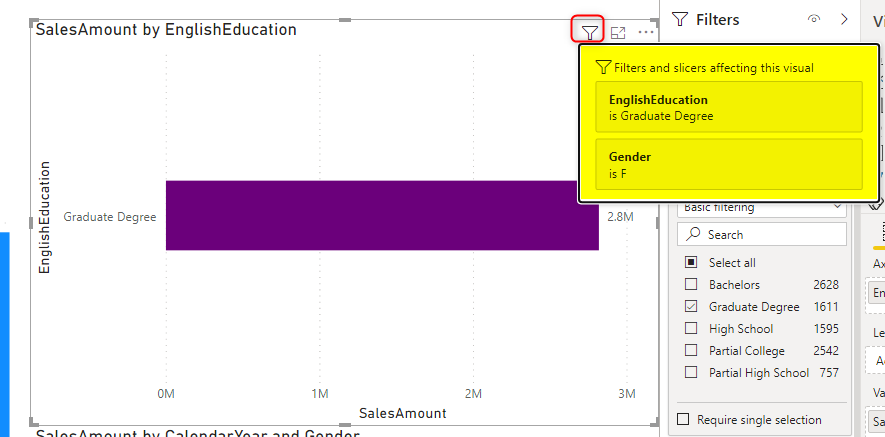
This will show the filters applied from anywhere (Visual, page or report-level), unless they are hidden (which I explain in another article).
Consider Filtering in the Power Query Editor
Using Visual-level filter and the Page-level filter both are common. However, If you are applying a Report-level filter (Filter on all pages), I strongly recommend you to consider an alternative. When you filter the data at the report level, this means you are not using the part that you filtered out. However, that part of the data is still there (in-memory), and affect the performance and the size of of the model.
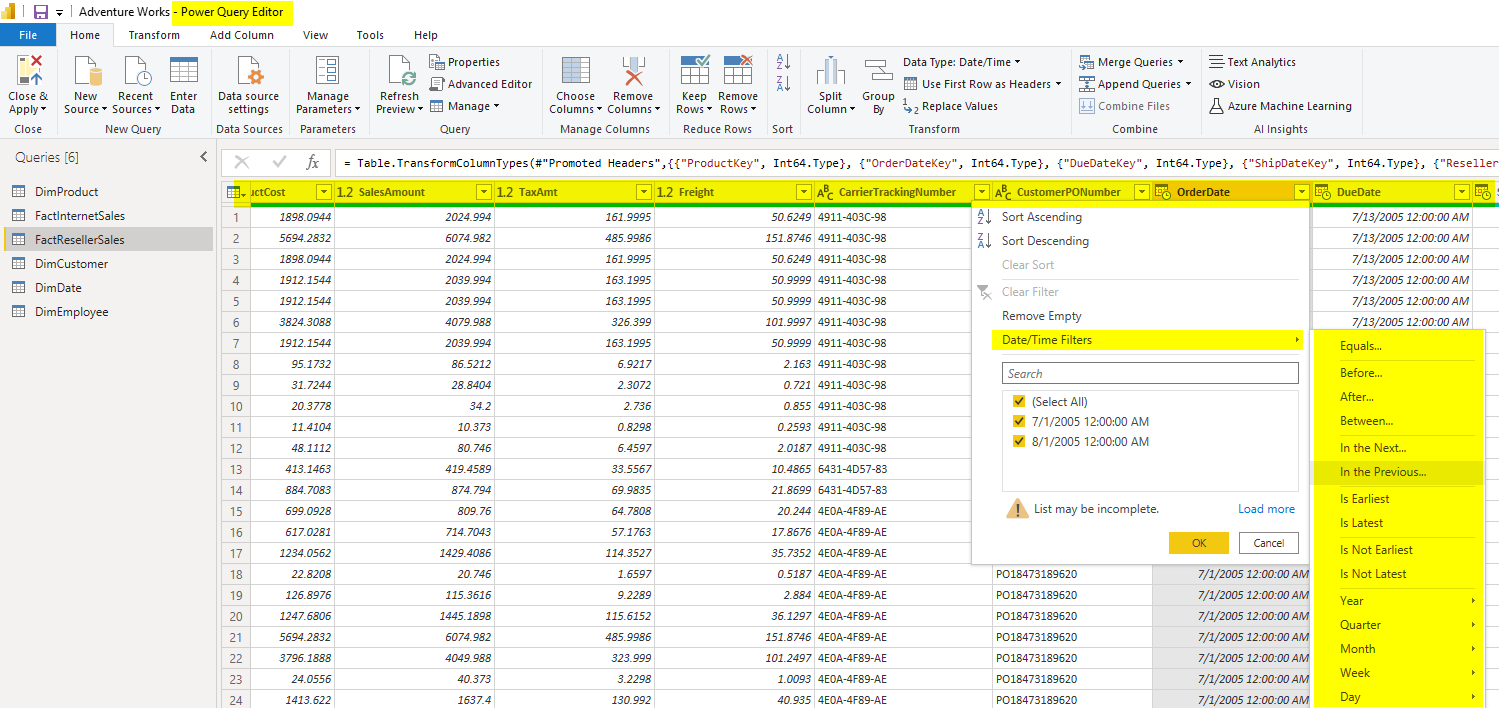
I would strongly suggest you to consider filter the data in Power Query Editor (or in the source). When you filter the data this way, the unwanted data will not be loaded into Power BI at all, and you will have a much better performing model.
To do this filtering, you need to go to the Transform Data from the Power BI Desktop, and then in the Power Query Editor window, you can click on any of the column headers and apply the filter you want.
Summary
There are three scopes of filtering for the visuals in Power BI; visual-level, page-level, and report-level. Depends on what items you want to filter, you can choose any combination of the above. If you are applying a report-level filter, I strongly recommend considering filter the data before loading it into Power BI. This can be done using Power Query Editor or filtering data from the source system.
There are more settings for the filters in Power BI, things such as locking filters, hiding them, and how to configure the look and feel of the filters pane. I’ll explain those in other articles in the future.


Reza is author of more than 14 books on Microsoft Business Intelligence, most of these books are published under Power BI category. Among these are books such as Power BI DAX Simplified, Pro Power BI Architecture, Power BI from Rookie to Rock Star, Power Query books series, Row-Level Security in Power BI and etc.
He is an International Speaker in Microsoft Ignite, Microsoft Business Applications Summit, Data Insight Summit, PASS Summit, SQL Saturday and SQL user groups. And He is a Microsoft Certified Trainer.
Reza’s passion is to help you find the best data solution, he is Data enthusiast.
His articles on different aspects of technologies, especially on MS BI, can be found on his blog: https://radacad.com/blog.