
Yesterday, I published a post about having a slicer that filters the rows in a table visual in Power BI that contains the characters from that slicer. A friend asked me what if we want to search for the first few characters? that means selecting the first character, then seeing all the possible second characters, and selecting from that list, then all possible third characters. and the table visual shows all text values with the result of all these selections. So, the result is this post. I’ll show you how this is possible;
Search all texts that Contain a Character
If you want to learn about the first step of this operation, check out my other blog article that I explained how you can achieve below:
The Desired Outcome
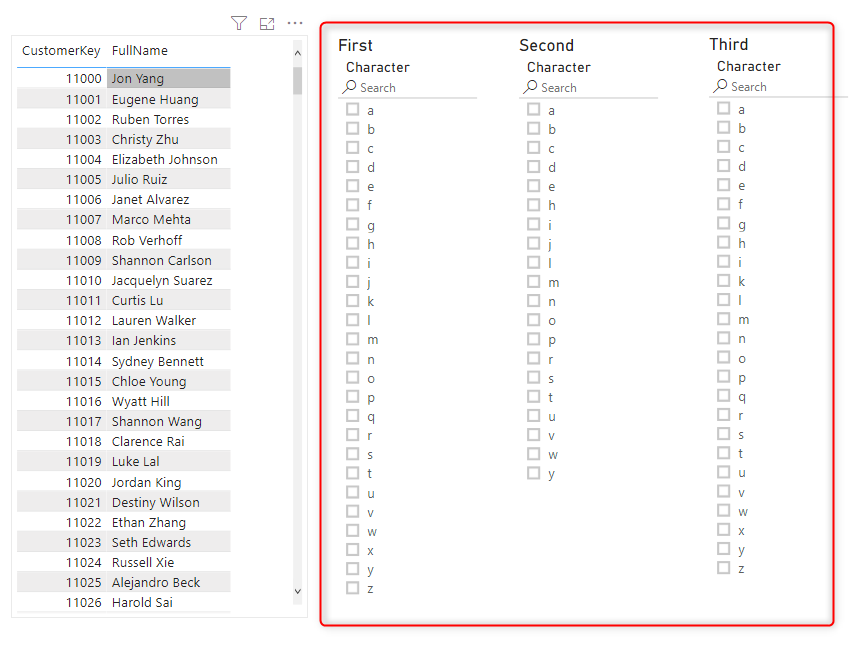
You might have seen some ticketing systems for trains where the user type in the character, and the machine shows all possible train station destinations based on that first world, then the user can type the 2nd character, and 3rd, etc. This is what you can do in Power BI too, Here is an example of what is expected:
Three Parameter tables
For this implementation, you need to have three Alphabet tables, the first table can be produced with the expression below;
Alphabet =
SELECTCOLUMNS(
GENERATESERIES(UNICODE('a'),UNICODE('z')),
'Character',
UNICHAR([Value])
)
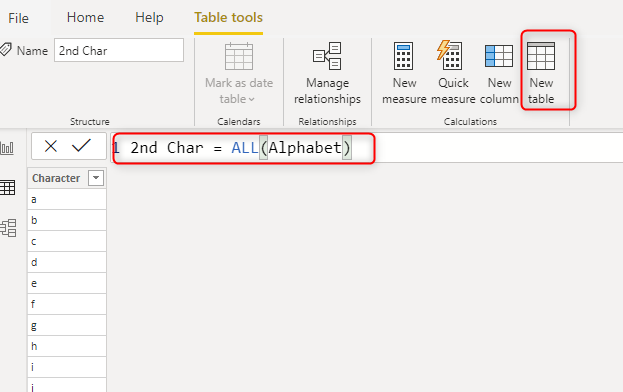
To avoid duplicating the code, the second and third table can be created just as role-playing-dimension copies:
2nd Char = ALL(Alphabet)
The model looks like below
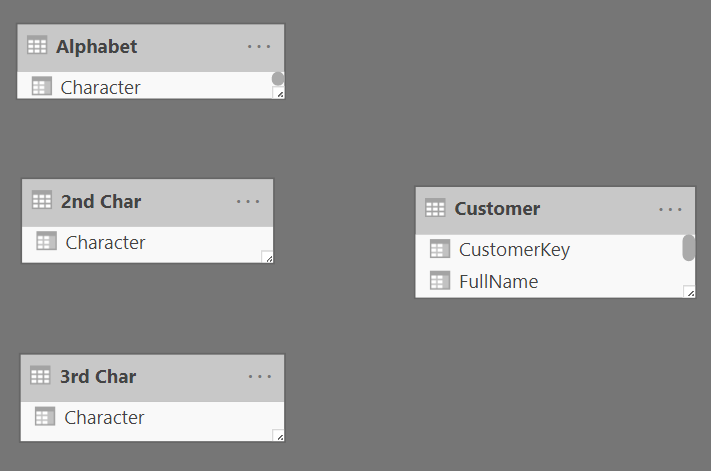
There is no relationship between these tables.
Three Slicers
Use the three tables respectively in three slicers as below;
DAX Measures
There is a bit of measure work involved in this solution, measure that can check the first, the second, and the third characters, and also measures to filter the visuals. below is the list of measures one by one:
First Character Matched
This measure checks that if the value in the first slicer, exists as the first character in the FullName column of the customer table or not. If the result of this measure is 1, then it means a match.
First character matched = SEARCH(
    SELECTEDVALUE(Alphabet[Character]),
    SELECTEDVALUE(Customer[FullName]),
    1,
    -1)
Second Character Matched
This measure checks that if the value in the second slicer, exists as the second character in the FullName column of the customer table or not. If the result of this measure is 2, then it means a match.
Second character matched =
var _selectedChar=SELECTEDVALUE('2nd Char'[Character])
return
if(ISBLANK(_selectedChar),2,
SEARCH(
    _selectedChar,
    SELECTEDVALUE(Customer[FullName]),
    2,
    -1)
)
Third Character Matched
This measure checks that if the value in the third slicer, exists as the third character in the FullName column of the customer table or not. If the result of this measure is 3, then it means a match.
Third character matched =
var _selectedChar=SELECTEDVALUE('3rd Char'[Character])
return
if(ISBLANK(_selectedChar),3,
SEARCH(
    _selectedChar,
    SELECTEDVALUE(Customer[FullName]),
    3,
    -1)
)
Now using the three measure above, we create some more measures for filtering as below;
Second Characters
This measure filters the second character slicer with all possible options based on the first character slicer selection;
Second Characters =
var _firstchars=
FILTER(
    Customer,
    [First character matched]=1
)
var _secondchars=
SELECTCOLUMNS(
ADDCOLUMNS(
    _firstchars,
    'second char',
    RIGHT(LEFT(Customer[FullName],2),1)),
    'char',[second char])
var _distictcharlist=
DISTINCT(_secondchars)
return
COUNTROWS(
    FILTER(
_distictcharlist,
[char]=SELECTEDVALUE('2nd Char'[Character])
)
)
Third Characters
This measure filters the third character slicer with all possible options based on the first and the second character slicer selections;
Third Characters =
var _firsttwochars=
FILTER(
    Customer,
    [First character matched]=1 && [Second character matched]=2
)
var _thirdchars=
SELECTCOLUMNS(
ADDCOLUMNS(
    _firsttwochars,
    'third char',
    RIGHT(LEFT(Customer[FullName],3),1)),
    'char',[third char])
var _distictcharlist=
DISTINCT(_thirdchars)
return
COUNTROWS(
    FILTER(
_distictcharlist,
[char]=SELECTEDVALUE('3rd Char'[Character])
)
)
Filtering Visuals by Measures
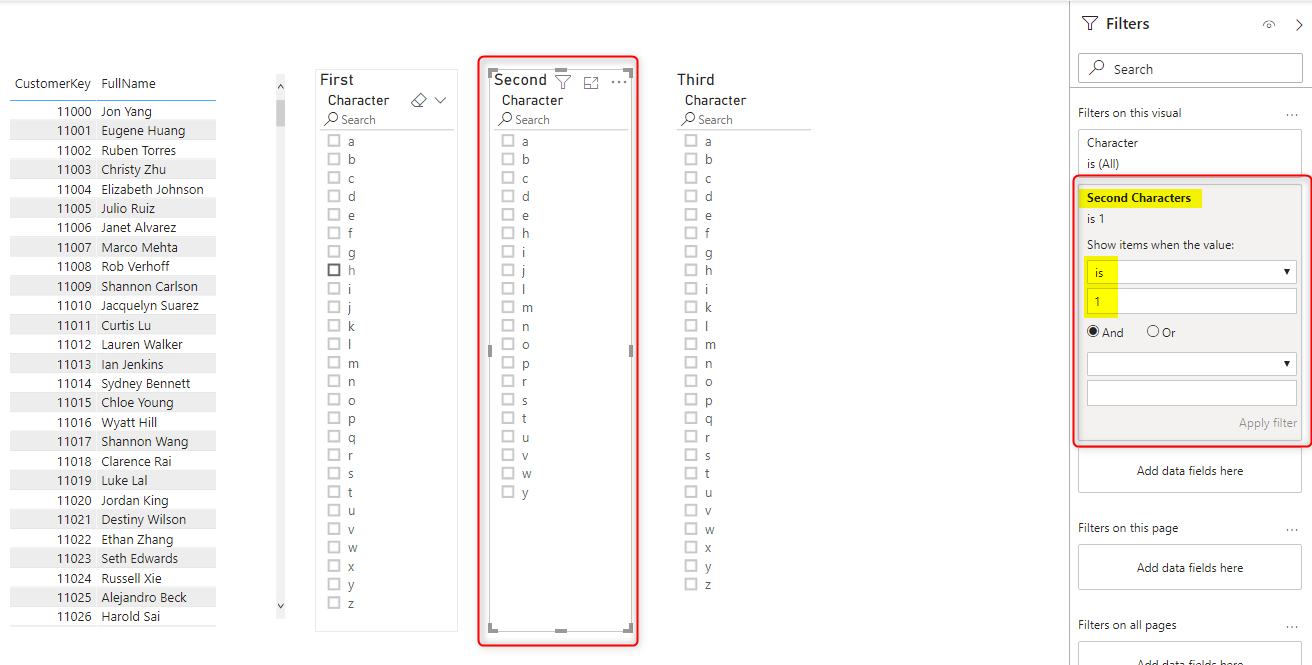
Now, as the last step, we can filter visuals by their respective DAX measure. The Second Character slicer visual is filtered by Second Characters to be 1.
the third character slicer is filtered by Third Characters to be 1.

The table visual is filtered by the three measures; First character matched, Second character matched, and Third character matched to be equal to 1, 2, and 3 respectively.
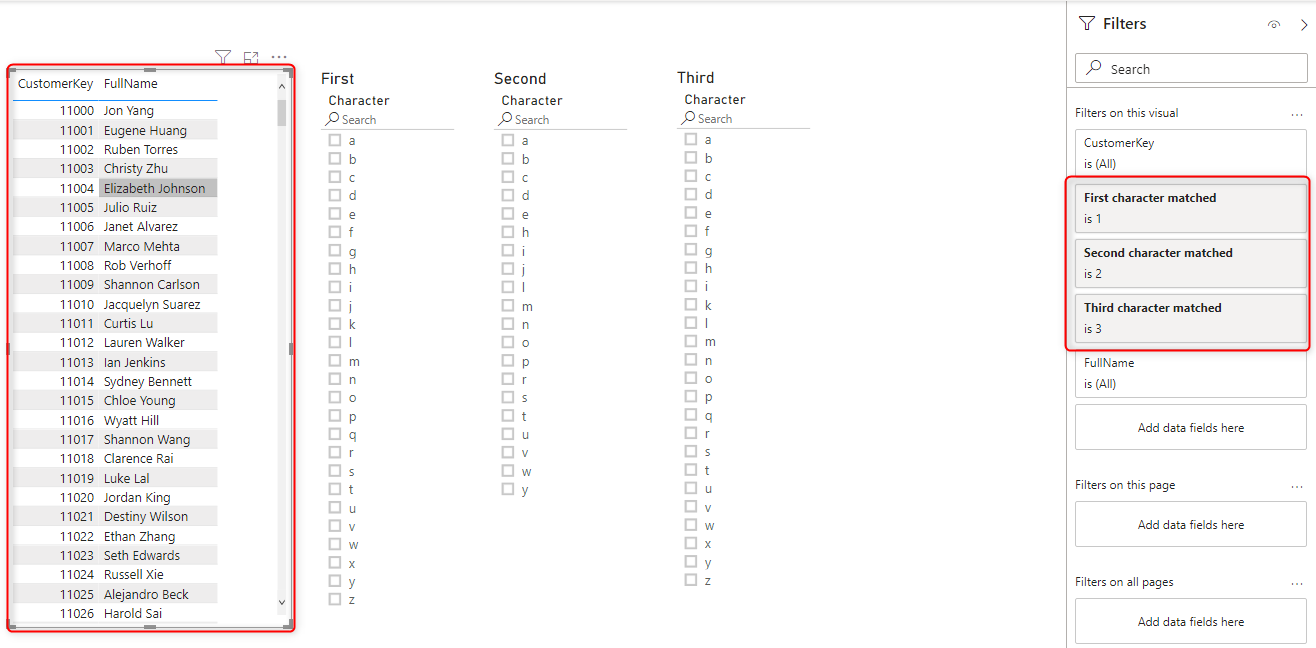
The final result is as below;
Summary
With a combination of parameter tables and filtering visuals based on DAX measures, you can achieve interesting results. I’m sure a filter capability like the above will be added soon in Power BI. However, until then, this can be a helpful solution for you. On the other hand, it teaches you how you can combine parameter tables, DAX, and filtering visuals together to get some results out of normal possibilities of the tool.
Download Sample Power BI File
Download the sample Power BI report here:
Video


Reza is author of more than 14 books on Microsoft Business Intelligence, most of these books are published under Power BI category. Among these are books such as Power BI DAX Simplified, Pro Power BI Architecture, Power BI from Rookie to Rock Star, Power Query books series, Row-Level Security in Power BI and etc.
He is an International Speaker in Microsoft Ignite, Microsoft Business Applications Summit, Data Insight Summit, PASS Summit, SQL Saturday and SQL user groups. And He is a Microsoft Certified Trainer.
Reza’s passion is to help you find the best data solution, he is Data enthusiast.
His articles on different aspects of technologies, especially on MS BI, can be found on his blog: https://radacad.com/blog.