
I have given many presentations and talks about Data Visualization, and still, I am amazed by how many visualizations I see which is not following the basic rules. In this article, I want to focus on table visual. A table is a visual that most of us are using it on many occasions, in fact, many users, like to see the data in table format. However, a table can be visualized in a way that is not readable. In this article, I’m showing you the most common style of a table which many report developers use, and then challenge it with a better style. The mystery is of course in conditional formatting. Like all my other articles, this article is demonstrating this technique in Power BI. If you like to learn more about Power BI, read Power BI book from Rookie to Rock Star.
Showing the Numbers
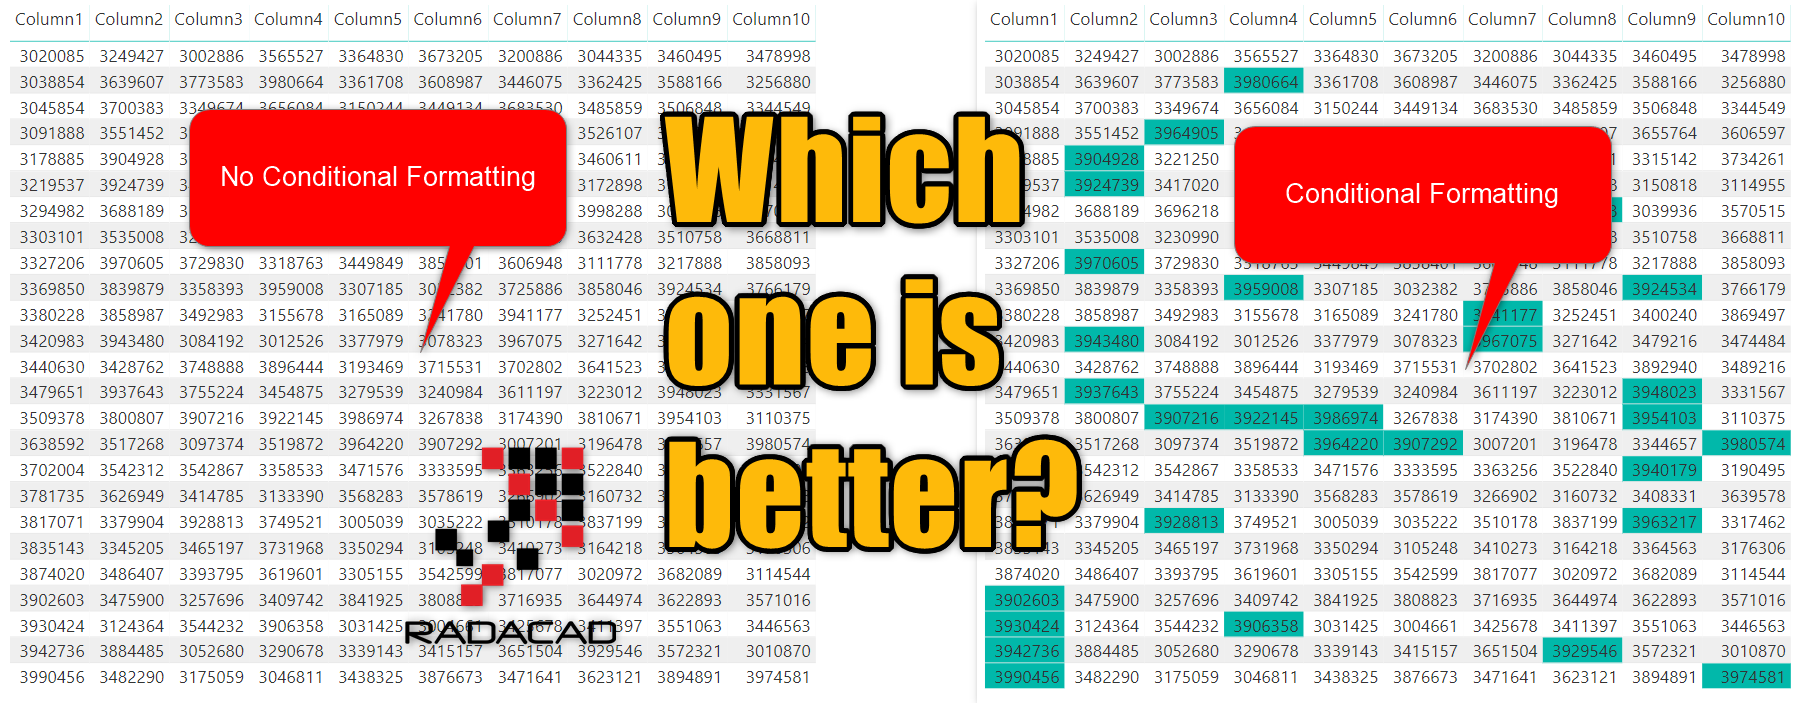
When it comes to showing numbers in a report, there are many options, many charts, and visualizations; bar chart, column chart, line chart and etc. A table is one of the visuals that many people like because it shows the values right away. When you ask your users; how would you like to see this report? their answer 90% of the time is, show me all the numbers in a table! And then you show it in a table like this:

Well, this is an example of a table with ten columns and lots of numbers! Now, let’s get some information out of this table.
What is the biggest number in the table?
Well, that is the question, isn’t it? How you are going to find that out? if it was just one column, you could have sorted it by the column itself. Although there are some scenarios that you want to see the biggest number without changing the sorting in the visualization. The biggest Number is not easy to find as you can see in the table above, the reason is that you are showing users, the FACTS, or the DATA, but not the Information! The user has to seek through the table, the user has to seek the information! Your job as a report developer is to ease that part is to give them information.
Your job as a report developer is to give users, INFORMATION, not just facts.
The table below shows the biggest number of the table. can you see it? or let’s say it better, can you Unsee it?!

But, what about the second biggest number? here it is:

Or more numbers in the biggest numbers range;

The same rule applies for the smallest numbers, the table below can help you to find a few smallest numbers in the table;

When you put a color (background or font color) on one or more numbers in this table, you get the attention of the user. The user’s eye, at first, will start by looking at those numbers. You are giving them information, you are telling them that; Hey, look, these are the biggest numbers, or the smallest numbers, or numbers close to a threshold that needs attention.
Changing a color, font family, font style, or size, can be a good way to get the attention of the user.
Conditional Formatting
In most of the data visualization tools, you can apply conditional formatting on table values. In Power BI, you can also do the conditional formatting on every column. You can put colors by rules, or by a diversity of values, and many other scenarios. As you learned so far, from the “showing the numbers” example, it is very important to have conditional formatting on your table. The golden rule is:
Never leave a table without conditional formatting.
Conditional Formatting is a simple change to the table visual, but it has an immense effect.
Applying Conditional Formatting
To apply the Conditional Formatting on a table, you need to go to the Format of the visual, and under conditional formatting, select the right column, and then choose the type of formatting you want to apply.

Configuring the Conditional Formatting is simple, If you have worked with conditional formatting in Excel, you will find it very similar to that.
There are three different types of formatting you can apply (if you have a text, or non-aggregatable column, then two option only); Background Color, Font Color, and Data Bars.

Here is an example of background color:

Font color conditional formatting:

And Data bars conditional formatting:

Condition Setup
There are also three ways that you can set up the condition for a column; Format by Color Scale, Rules, or Fixed Value.

Here is an example of the format by color scale:

and Format by Rules

Format by Fixed value is an interesting option, which I will be showing in another article separately, but here is an example of how it works:
You can have a field for background color, and a field for font color, and then use Fixed value option for formatting;

Here is an example result:

Summary
Your job as a data visualizer is not only to show facts to the user but also to show them the information. A table or matrix visual is not a visual that can convey information easily. In this article, you have seen how conditional formatting can be effective in passing the right message to your audience.


Reza is author of more than 14 books on Microsoft Business Intelligence, most of these books are published under Power BI category. Among these are books such as Power BI DAX Simplified, Pro Power BI Architecture, Power BI from Rookie to Rock Star, Power Query books series, Row-Level Security in Power BI and etc.
He is an International Speaker in Microsoft Ignite, Microsoft Business Applications Summit, Data Insight Summit, PASS Summit, SQL Saturday and SQL user groups. And He is a Microsoft Certified Trainer.
Reza’s passion is to help you find the best data solution, he is Data enthusiast.
His articles on different aspects of technologies, especially on MS BI, can be found on his blog: https://radacad.com/blog.
Thanks for the article. But I have not learned how to conditionally condition the largest (or smallest) value …
How did you mark it green in your second screenshot?
Hi Denis.
That method is explained in the second post in this series here.
Cheers
Reza
Hi Reza,
awesome article, again!
Your last example (background and font formatting) is awesome, one more question:
You have a „Product“-Column that is formatted by the two columns „Background color“ and „Font Color“. When you have another column like „Value“ or „Quantity“ that corresponds to the „Product“-column, how can you format it the way like the „Product“-column?
To stay in your example, all the „Values“ or „Quantities“ of Product 1 and Product 10 in red/white, all the „Values“ or „Quantities“ of Product 11 in blue/white and so on?
I‘ve tried by myself, but failed…
Cheers,
Sebastian
Hi Sebastian
If I understand your question correctly; you want the whole row to be formatted like that.
Unfortunately, we do not have such option YET. However, right now you can go to each column’s conditional formatting and set all of them the same. You can conditionally format one column by other columns and measures.
Cheers
Reza