

Sum and Sumx are functions that often founded to be misleading for many Power BI users. As both functions are doing the aggregation, it seems a bit confusing what is the actual difference between these two. There are many blog posts and articles about each function. I always explain the difference with simple demos in my courses and presentations, and people find it easy to understand. So, I thought better to write it in a blog post for everyone to read. If you want to learn more about Power BI, read Power BI from Rookie to Rock Star book.
SUM: Aggregation Function
SUM is a simple aggregation function. It summarizes a value based on a filter context. For example, if I have a measure like:
Sum of Sales = SUM(FactInternetSales[SalesAmount])

This measure is simply calculating the summarized value of the SalesAmount across the entire fact table when there is no filter selected. And if I have a filter somewhere in my visualization, then it will calculate the sum of the filtered context;

All other aggregation functions are also working the same; Average, Min, Max, Count, and etc. Now let’s see when SUM functions fall short.
SUMX: Some of an Expression
Let’s now calculate the sum of margin, which is: the sum of sales minus cost. This calculation is considering that we do NOT have a column as a margin in our model, and we do not want to create that column. Let’s see how it is possible through a measure to calculate the sum of Margin.
Margin calculation is: SalesAmount – TotalProductCost
But you cannot write a measure like below:

In fact, when you start writing that measure, you don’t even get the DAX intelligence for the second part of your expression:

DAX intellisence doesn’t show the TotalProductCost column from the FactInternetSales table, but the column is definitely in the table. The intelligence in DAX is always reliable, If it doesn’t allow you to write something somewhere, it means based on the structure of your expression or functions that you’ve used, it is not probably the right place to write it. So why you cannot write such a simple statement?
Because SUM only accepts a column name as input. Here is the structure of the SUM function;

As you can see the input is just one column name. It cannot be one column minus another one; that means an expression. So, what is the way to do it? One way is to use multiple sum functions, such as below code:
Sum of Margin = SUM(FactInternetSales[SalesAmount])-SUM(FactInternetSales[TotalProductCost])
And it would work. However, for long expressions, this way of writing will become hardly readable. If you add one Sum in front of every column name, you may end up with expressions such as below;
A measure with few SUMs =
if((SUM(FactInternetSales[SalesAmount])
-SUM(FactInternetSales[TotalProductCost]))
/SUM(FactInternetSales[OrderQuantity])
>SUM(FactInternetSales[ExtendedAmount])
,SUM(FactInternetSales[ExtendedAmount])
-SUM(FactInternetSales[SalesAmount])
,SUM(FactInternetSales[OrderQuantity])
*(SUM(FactInternetSales[UnitPrice])
-SUM(FactInternetSales[UnitPriceDiscountPct])))
Looks scary, isn’t it? Well, there is another way; use SUMX. SUMX is the sum of an expression, the X at the end of this function is for eXpression. This function gives you the sum of any expression. Here is the way to use it:
SumX(<table name>,<expression>)
For SUMX to work, you need to specify a table name. When you use SUM you do not need a table name, because one column only belongs to one table. But when you use SUMX you may write an expression which uses columns from other tables. In the example for Margin, both columns are coming from the same table; FactInternetSales. So, our expression would be:
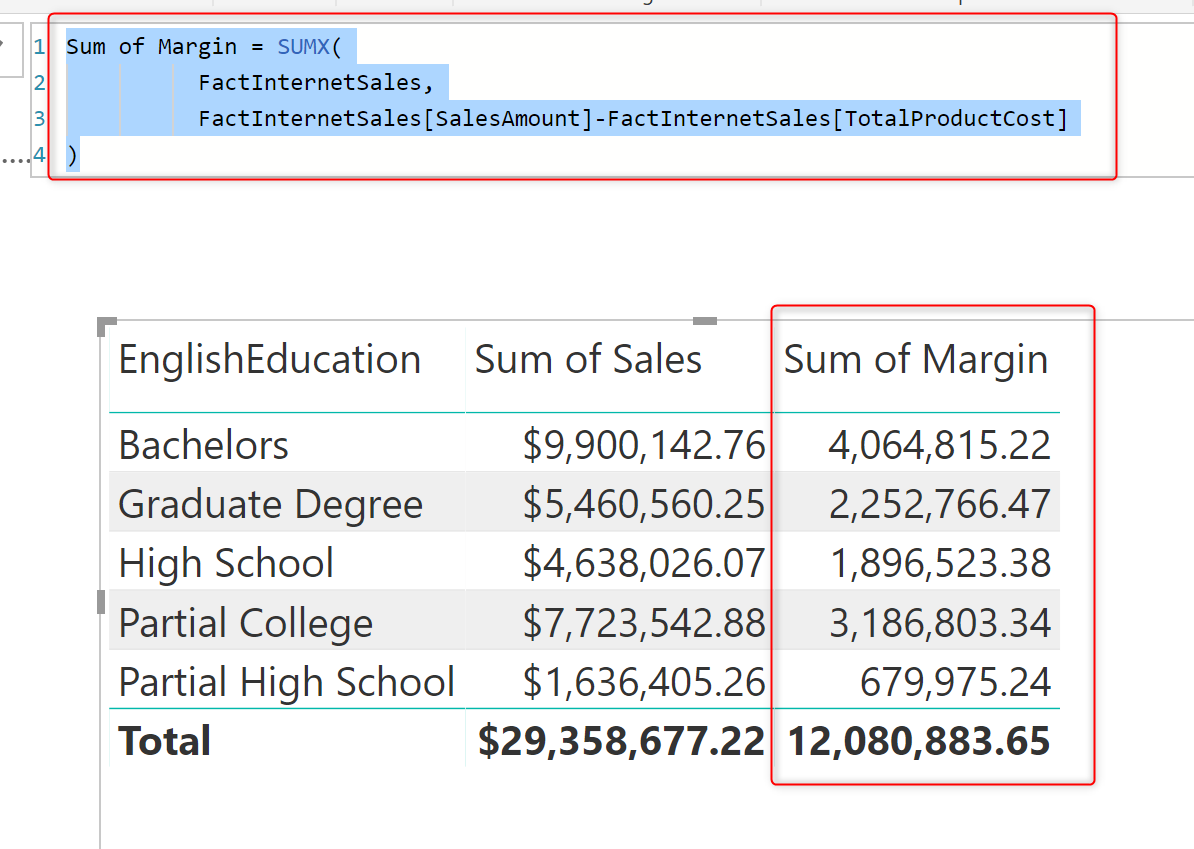
Sum of Margin = SUMX(
FactInternetSales,
FactInternetSales[SalesAmount]-FactInternetSales[TotalProductCost]
)
SUMX is the sum of an expression, but SUM is just summarizing values of one single column.
SUMX is an Iterator Function
How SUMX behind the scene is doing the calculation? SUMX will go through every single record of the input table and run the expression for that record, it stores the result of that into a temporary memory.

At the end of parsing the table and calculating all values for every single row, it will summarize them all together, because it is SUMx, releases the temporary memory, and visualize the result;

Because of this ITERATION nature of the SUMX function, it is also called as Iterator function. Other iterator functions are: AverageX, MinX, MAXX, CountaX, etc.
Iterator functions are looping through all rows in the input table and storing the expression result in a temporary memory storage. At the end they apply the aggregation on the temporary storage results, release the memory usage, and visualize the calculation result.
One important understanding about SUMX so far, is that SUMX uses memory (temporarily, but still uses memory) for calculation. Another important finding is that it calculates values row by row. If you run SUMX on a very large table with a complex expression, you probably need to wait a bit for results to come through.
The hidden gem of the SUMX; Table Input
The example, you have seen so far about the SUMX was an easy one, which you could even write it without SUMX (remember the way we did it with multiple SUM functions). But the hidden gem of using SUMX function is not just the flexibility on the expression, it is also the flexibility on the table input.
Let’s say you want to calculate total margin in an expression. How we are going to do that? Well, you may say we just use the same SUMX statement that we have used so far, which gives us the result below;

But the expression above is not always giving you the total of margin. If you slice and dice it by a column here is the result;

Filter context (or let’s say whatever filters the visual) will impact the calculation result. So, when you are looking at Bachelors education category, the sum of Margin for that is not the total margin, it is just sum of margin for that category.
ALL is an interesting function, which I write about it later in another blog post, in the meantime, if I use ALL function to give me the entire table regardless of the filter context, this is what my expression and the result would look like:
Total Margin = SUMX(
ALL(FactInternetSales),
FactInternetSales[SalesAmount]-FactInternetSales[TotalProductCost]
)

How does this work? ALL is a function that returns a table as output. SUMX is a function that gets a table as input. So they can work with each other nicely! ALL can be the input table of the SUMX function. Nesting or cascading functions and tables into each other is something that happens very often in DAX. Because ALL is a function that passes the entire table regardless of the filter context, so, we get the full FactInternetSales table with no filters, and the result would be always the total margin.
You may think, what is the usage of such a thing? Well, you can use it to calculate the percentage of the margin for each education category. Here is how it works:

Any TABLE can be the Input for SUMX
It is not just ALL function that can be the input for SUMX, you can also use any other functions that return table, or any other tables as the input for the SUMX. For example, expression below is giving us the Filtered result of the FactInternetSales table, when the Education category is “High School”;
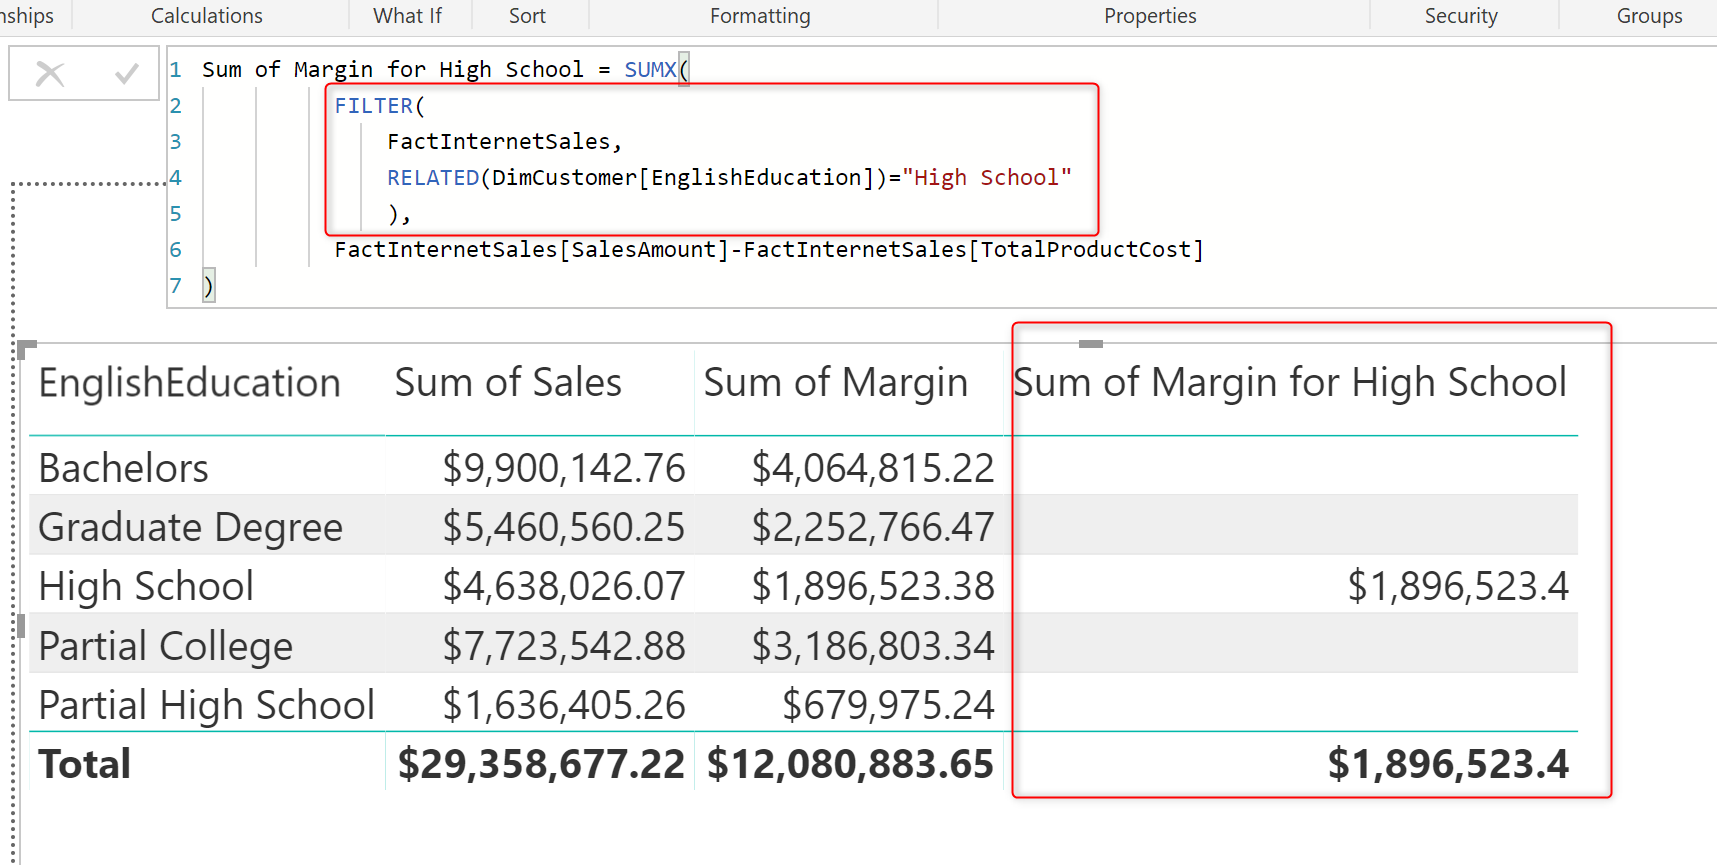
In this example, FILTER function used as the input for SUMX to give us the calculation result only on a filtered dataset.
Sum of Margin for High School = SUMX(
FILTER(
FactInternetSales,
RELATED(DimCustomer[EnglishEducation])="High School"
),
FactInternetSales[SalesAmount]-FactInternetSales[TotalProductCost]
)
This can be done with other functions as well. Here, for example, I used the CalculateTable function to do the filtering:
Sum of Sales by Customer = SUMX(
CALCULATETABLE(
FactInternetSales,
DimCustomer[EnglishEducation]="High School"
),
FactInternetSales[SalesAmount]-FactInternetSales[TotalProductCost])
The result is:

SUMX is a function that you can set an expression and a table as the input. Having the ability to change both the expressio, and the table (as a filter or something else), makes this function a generic function to use in DAX.
There is a function that can act more generic than SUMX, called Calculate. I’ll write about it in another blog post.
Summary
Sum and SumX both are functions calculating aggregation. However, the SUMX calculates the aggregation on an expression resolved from a table which can be dynamically calculated as well. SUMX is a generic and powerful function, that is why we see the usage of that a lot in DAX. One thing to remember is that SUMX like any other iterator functions, is consuming temporary memory storage and doing the calculation one row at a time, then aggregates it. Do you use SUMX? Let me know where and in which scenarios do you use SUMX for, and ask any questions in the comments below.


Reza is author of more than 14 books on Microsoft Business Intelligence, most of these books are published under Power BI category. Among these are books such as Power BI DAX Simplified, Pro Power BI Architecture, Power BI from Rookie to Rock Star, Power Query books series, Row-Level Security in Power BI and etc.
He is an International Speaker in Microsoft Ignite, Microsoft Business Applications Summit, Data Insight Summit, PASS Summit, SQL Saturday and SQL user groups. And He is a Microsoft Certified Trainer.
Reza’s passion is to help you find the best data solution, he is Data enthusiast.
His articles on different aspects of technologies, especially on MS BI, can be found on his blog: https://radacad.com/blog.
Nice explanation. Would be nice to have a video in this topic tho.
Thanks very much.
Sure. Video will be coming.
Nice article , very well explained with right set of examples.
Thanks. Glad you liked it ?
This has cleared all my doubts. Very well explained. I do follow all your blogs, videos and that help me a lot. Thank you for all your efforts to make people understand things in a easy way.
Thanks for your kind words ??
Hi Reza,
First of all thank you for this interesting and helpful article.
Is it true to refuse using SUMX because of memory misuse and its row by row calculation and use calculated column in power query for this reason? So in this case I increase redundancy of my model!
cloud you please tell which one is more efficient? SUMX or calculation in power query
Hi Sajjad
There is never a definite answer to questions like this. It should be checked case by case and scenario by scenario.
SUMX can be slow, but it can be also very effective in some scenarios.
replacing row-by-row based measures by a transformation set in Power Query is definitely good if your row-by-row operation is nothing dynamically based on the selection of slicer or user interaction in the report. Having things pre-calculated is always a good method to speed things up in Power BI.
However, there are scenarios that you need the interaction of user, especially on slicers to affect the way that calculation evaluated. and for those, you need to use measures.
Cheers
Reza
Superb article .thank you. Need such kind of more articles
Thanks a lot for explaining the difference between the SUM and SUMX functions. Really appreciate it! 🙂
wonderful, excellent breakdown of sum and sumx. thanks for the effort.
Thanks a lot for such a detailed explanation.
Great article and examples. Thanks for making it so clear.