
In some of the reports with many pages, some of the slicers are common, and all pages need to have them. Moreover, in some data analysis approach, we may want to apply one slicer, not on-page, but in all other pages in our reports. In this scenario, we need to use the sync slicers option in Power BI
In this blog post, I am using the Power BI sample dataset about financial data to show how to use synch slicers.
Scenario
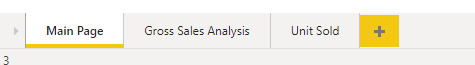
I have three pages report, that the first page is general data about Profit, Sales, and Unit sold. I have two other pages that one analysis the Gross Sales and the later one Unit Sold. There are some common slicers in these three pages that I can set it up on page one and sync them on other pages.
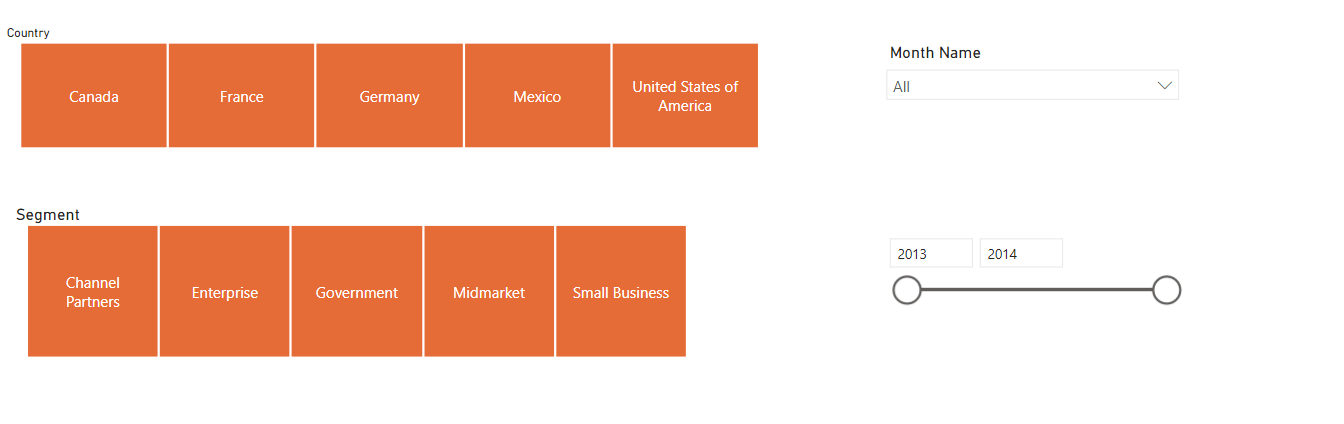
Month name, Date, Segment, and Country.
Report design requests :
we wat that on all pages, slice the data to Month name, which is set to January, and show the Month Name slicer in Gross Sales Analysis pages and Not show the slicers on the Unit Sold page, but slice the page on January.
First, you need to choose Month Name slicer, then click on View, then Sync Slicers
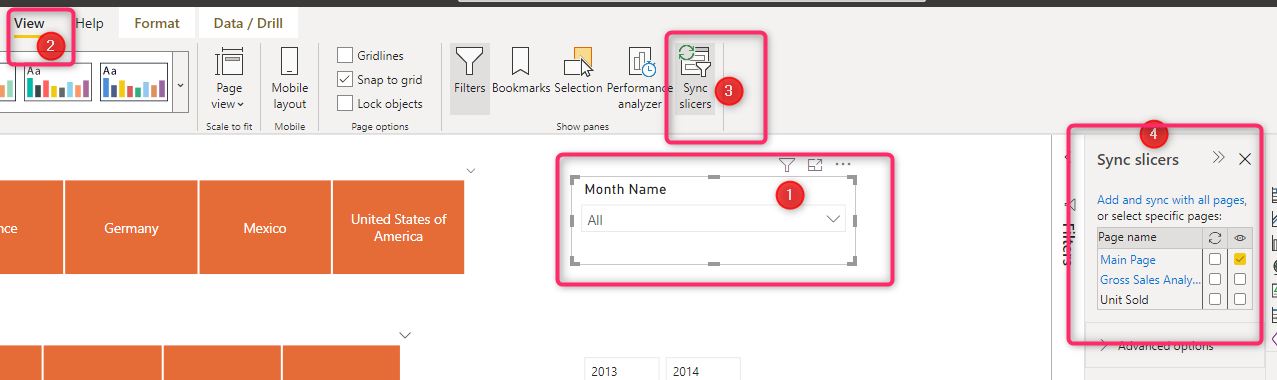
Now we can see a Sync Slicer tab in the right of the report. The menu has three column
Page Name, refresh icon, and eye icon
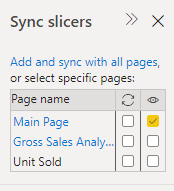
refresh icon means the slicer can slice and dice the selected pages, the eye icon means, it will appear in the pages, the default situation is that the Mont Name slicer is shown on the Main Page.(Above screenshot)
Now I want to set the slicer to slice and dice all three pages, but only shown in Main Page and Gross Sales Analysis page.
I need to set the sync slicer as below
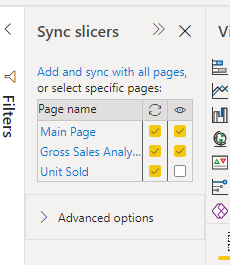
Just make sure to select the refresh icon for all pages ( even the main page that the original slicer was there)
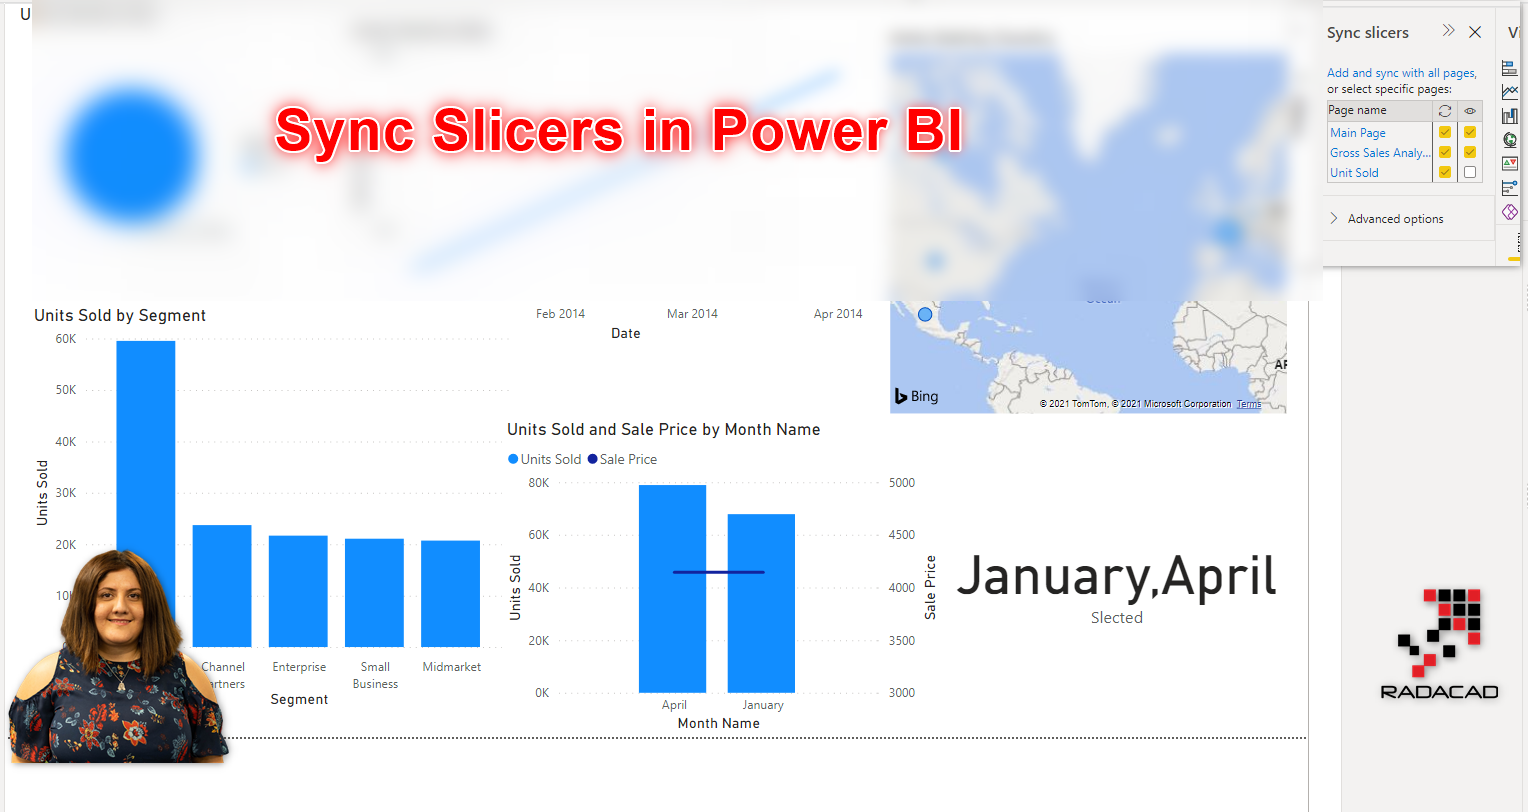
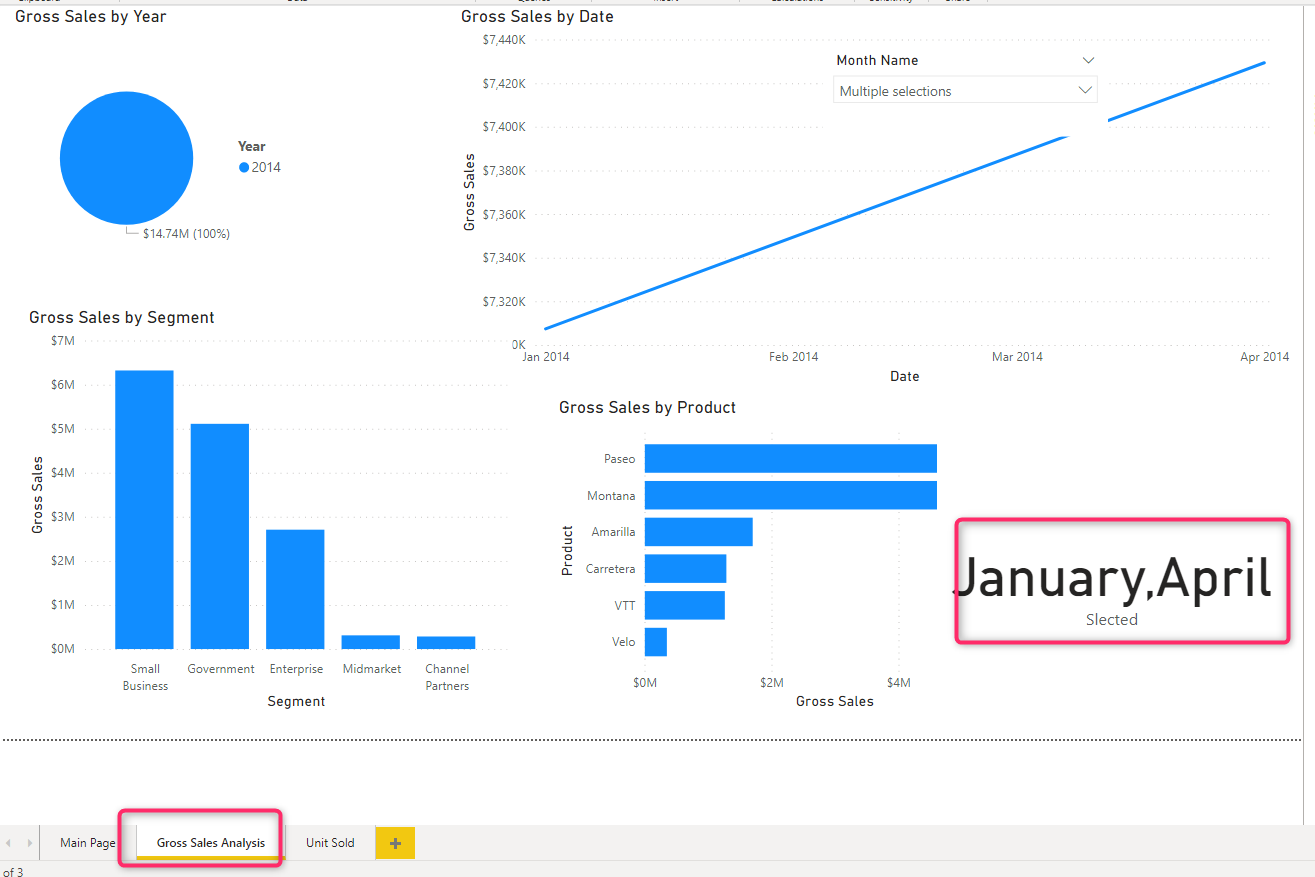
Now let’s check out the result on the Gross Sales Analysis pages. As you can see in the below image, the Month’s name appears in the same place as the main page, also it was selected to be January and April.
The other page, Unit Sold, as you can see in the below screenshot, there is no slicer, but the Mont name has been selected to be January and April as well.
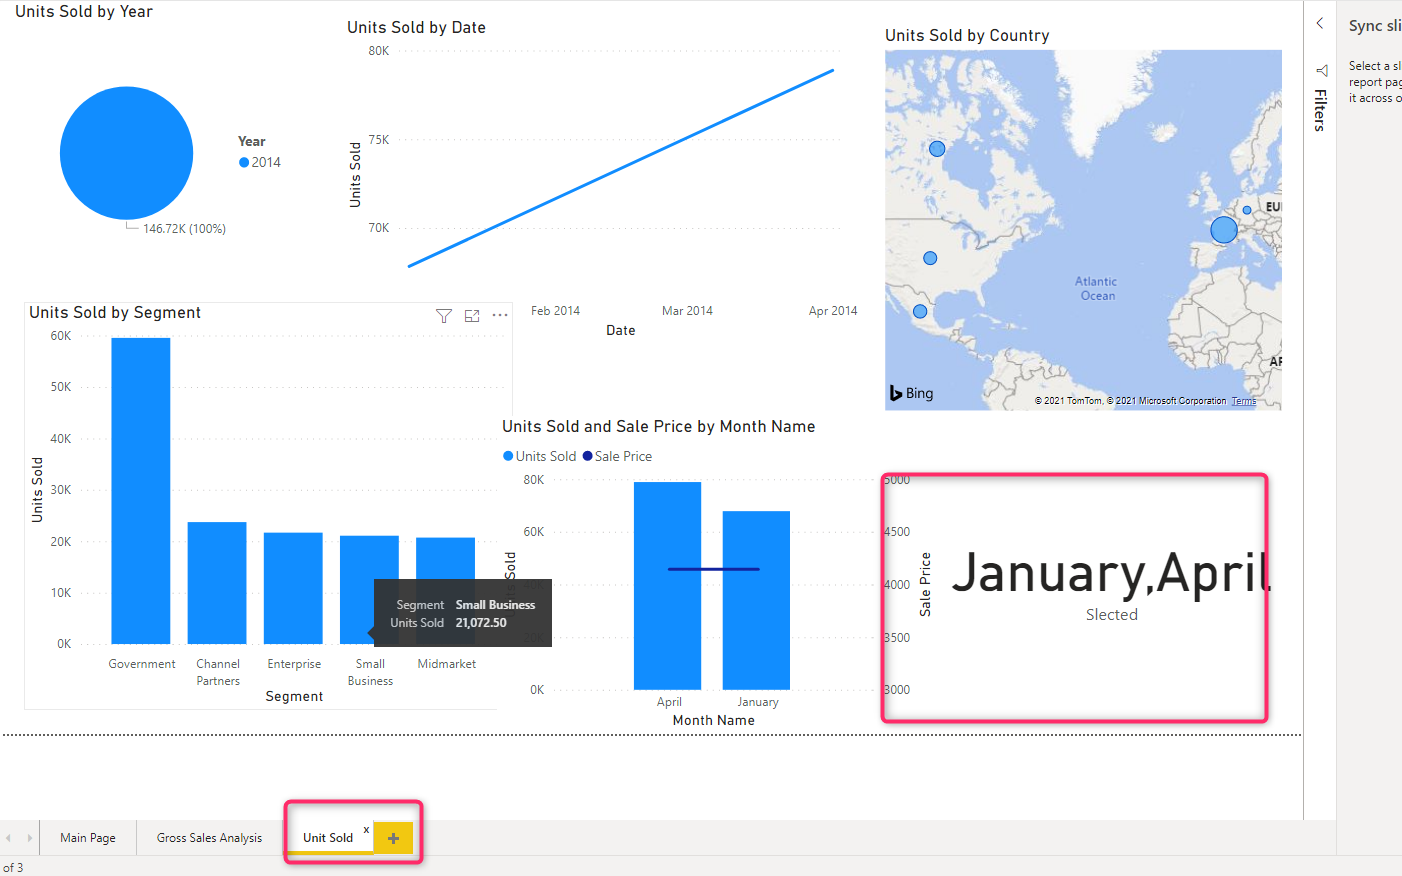
it is recommended to show which month name you choose if you do not put the slicer on the page, I use a card visual with the below DAX code to show which month has been selected
Slected = CONCATENATEX(VALUES(financials[Month Name]),financials[Month Name],”,”)
Download the file from here
Sync Slicers File (42486 downloads )


