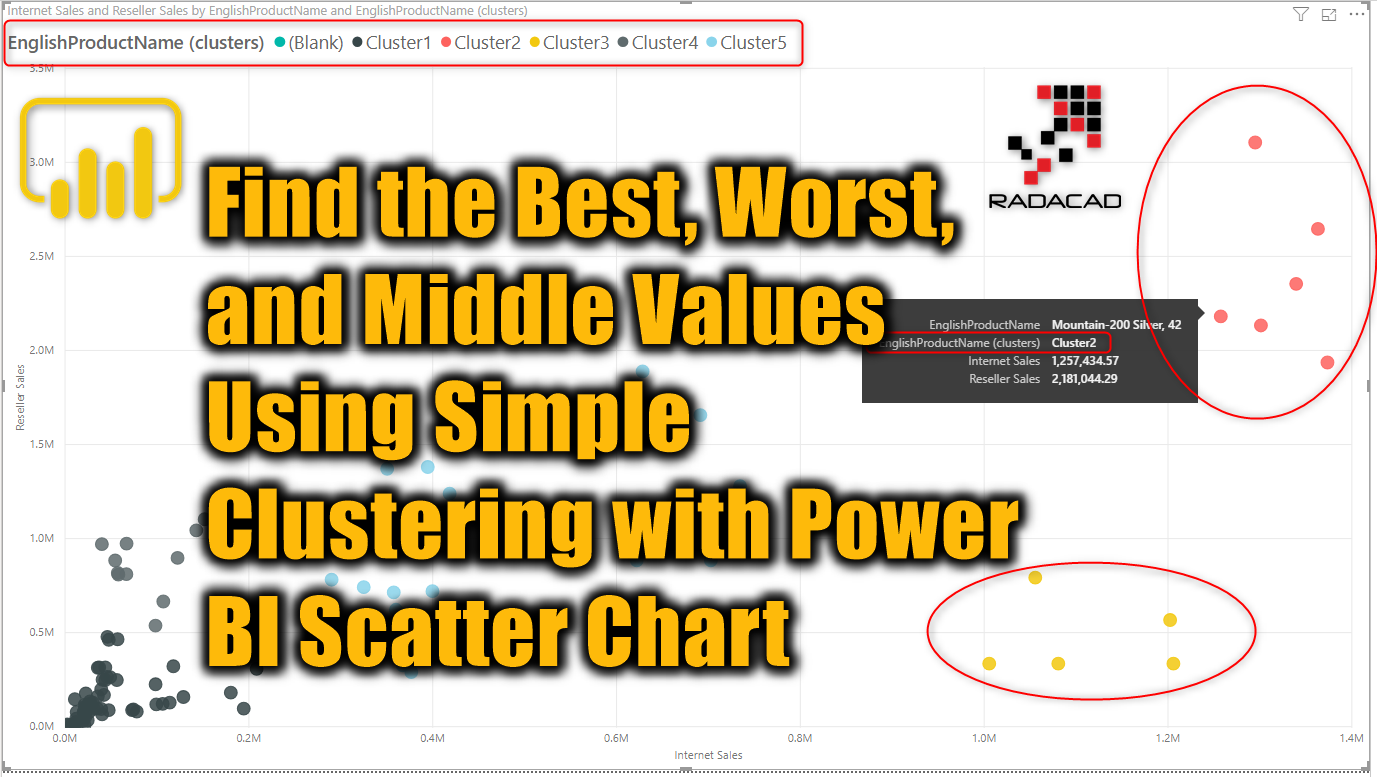
Find the Best, Worst, and Middle Values Using Simple Clustering with Power BI Scatter Chart
Machine Learning and AI can be advanced areas, however, there are some easy to use methods for that especially in the Power Platform and Power BI. Leila has written tons of blog articles about AI in Power Platform. However, as a visualization point of view, I want to show you a feature that you might Read more about Find the Best, Worst, and Middle Values Using Simple Clustering with Power BI Scatter Chart[…]