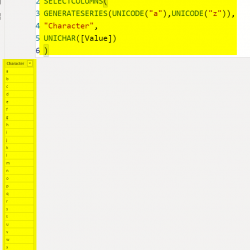
Subscription Pattern in Power BI – DAX Measure for Active Subscribers or Open Tickets For All Dates

One of the common patterns of a data model is the subscription pattern. In this pattern, we have subscriptions (or tickets, or issues, or whatever else you want to call it) open date and close date. The way that this data is stored in a table makes it a bit challenging to get informative insight Read more about Subscription Pattern in Power BI – DAX Measure for Active Subscribers or Open Tickets For All Dates[…]

Dynamic Banding or Grouping in Power BI – Using DAX Measures – Choose the Size of Bins

In the previous article/video, I explained how to create dynamic bins by choosing the count of bins in a slicer in the Power BI report. In this article, I’ll explain, how you can do it the other way around, which is by selecting the size of the bin, you will have bins and buckets dynamically Read more about Dynamic Banding or Grouping in Power BI – Using DAX Measures – Choose the Size of Bins[…]

Dynamic Banding or Grouping in Power BI – Using DAX Measures – Choose the Count of Bins

Banding (or binning or grouping) is a scenario that can be implemented both statically and dynamically in Power BI. Dynamic banding means selecting the bin (or band) configuration, and the banding changes based on the user selection of the slicer. Imagine that we have a count of customers by their age groups, but then we Read more about Dynamic Banding or Grouping in Power BI – Using DAX Measures – Choose the Count of Bins[…]

Age Banding in Power BI Using TREATAS DAX Function – Relationship Based on Between

One of the most common types of banding or binning is banding based on a range. Let’s say, for example,  you want to have a group of customers based on their age group. The age group banding can be created in Power Query at the data transformation stage. It can be created using the Grouping Read more about Age Banding in Power BI Using TREATAS DAX Function – Relationship Based on Between[…]

Creating Relationship Based on Multiple Fields in Power BI Using TREATAS DAX Function

TreatAs is helpful for filtering, and it doesn’t filter only based on one column, it can filter based on as many as columns you want. One of the challenges in Power BI relationships is creating a relationship based on multiple fields, I have previously explained a method you can use to create a compound key Read more about Creating Relationship Based on Multiple Fields in Power BI Using TREATAS DAX Function[…]

Building a Virtual Relationship in Power BI – Basics of TREATAS DAX Function

TreatAs is an interesting function with multiple use cases in Power BI. I thought it is good to explain it in a set of articles, the first one here is about what the TreatAs function is and how it can help to build filters and a virtual relationship between two tables. Let’s see how you Read more about Building a Virtual Relationship in Power BI – Basics of TREATAS DAX Function[…]

Customers Grouped by the Count of their Orders – Dynamic Segmentation in Power BI Using DAX Measures

In the previous part of this article, I explained what is the segmentation challenge, when you want to group data based on the aggregated result, and I explained a static method of creating aggregated tables and creating a relationship to the main detailed table. However, the caveat of that method is the segmentation is done Read more about Customers Grouped by the Count of their Orders – Dynamic Segmentation in Power BI Using DAX Measures[…]

Customers Grouped by Count of Their Orders – Static Segmentation in Power BI

One of the interesting calculation challenges in BI systems is a segmentation or grouping on a numeric value, based on an occurrence of another value. As an example; You might want to know How many customers ordered once, twice, three times or more. The challenge is that the data in the transactional table is not Read more about Customers Grouped by Count of Their Orders – Static Segmentation in Power BI[…]

Customer Retention in Power BI: DAX Measures

Customer retention is one of the most common scenarios of data analysis, which is very useful for business. As a business, you would like to know how many new customers you have in each month, how many returning,  and how many lost customers. Knowing these, would help you to focus on the growth plan, and Read more about Customer Retention in Power BI: DAX Measures[…]

Move Measures to Another Table in Power BI

The ability to move measures from one table to another table exists in Power BI, However, the process is not familiar for many users. Through my consulting and training work I have explained it to many of my clients. The process is simple and much better than re-creating the measure again and deleting the old Read more about Move Measures to Another Table in Power BI[…]