Identifying Number of Cluster in K-mean Algorithm in Power BI: Part 7

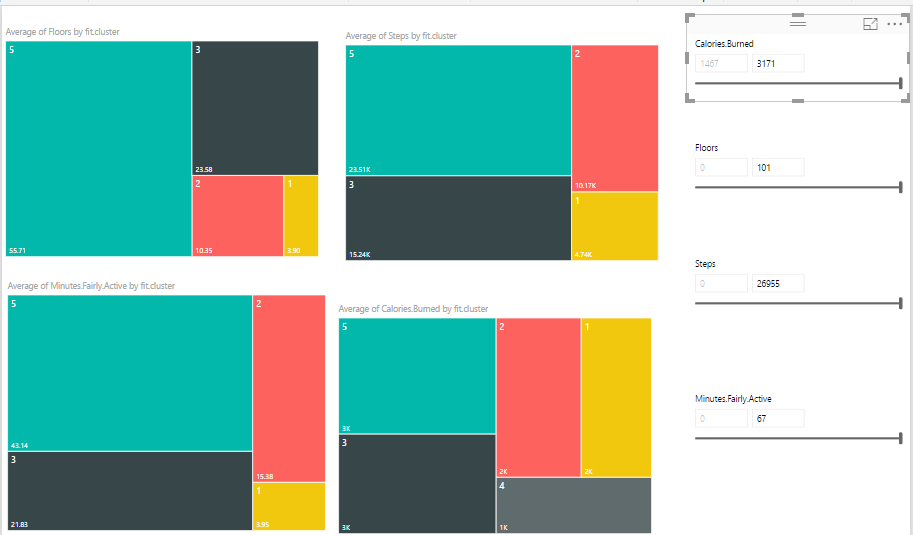
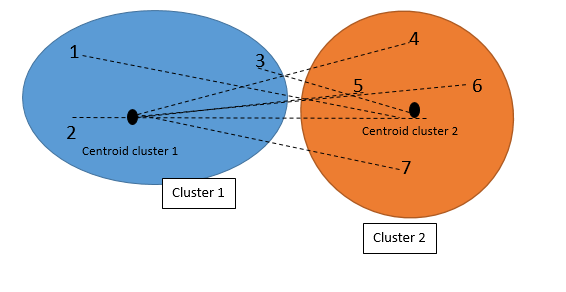
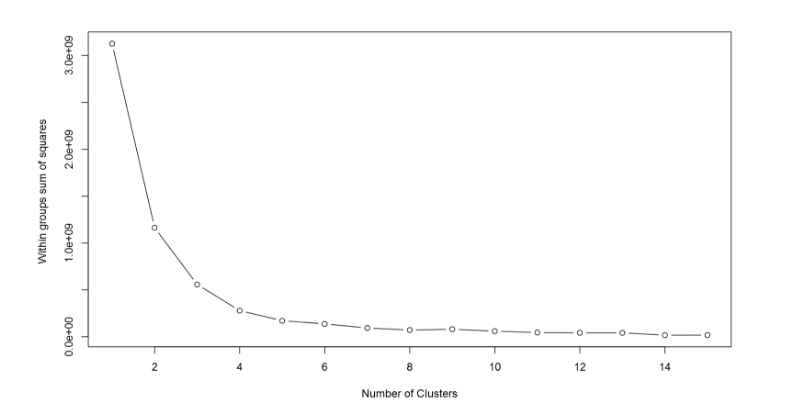
I have explained the main concept behind the Clustering algorithm in Post 5 and also I have explained how to do cluster analysis in Power BI in Part 6. In this post, I will explain how identify the best number of cluster for doing cluster analysis by looking on the “elbow chart” K-Mean clusters the data Read more about Identifying Number of Cluster in K-mean Algorithm in Power BI: Part 7[…]

K-mean clustering In R, writing R codes inside Power BI: Part 6

In the previous post,I have explained the main concepts and process behind the K-mean clustering algorithm. Now I am going to use this algorithm for classifying my Fitbit data in power BI.   as I have explained in part 5, I gathered theses data from Fitbit application and I am going to cluster them using Read more about K-mean clustering In R, writing R codes inside Power BI: Part 6[…]

Clustering Concepts , writing R codes inside Power BI: Part 5

Sometimes we just need to see the natural trend and behaviour of data without doing any predictions. we just want to check how our business data can be naturally grouped. According to the Wikipedia , Cluster analysis or clustering is the task of grouping a set of objects in such a way that objects in the same group (called a cluster) Read more about Clustering Concepts , writing R codes inside Power BI: Part 5[…]