
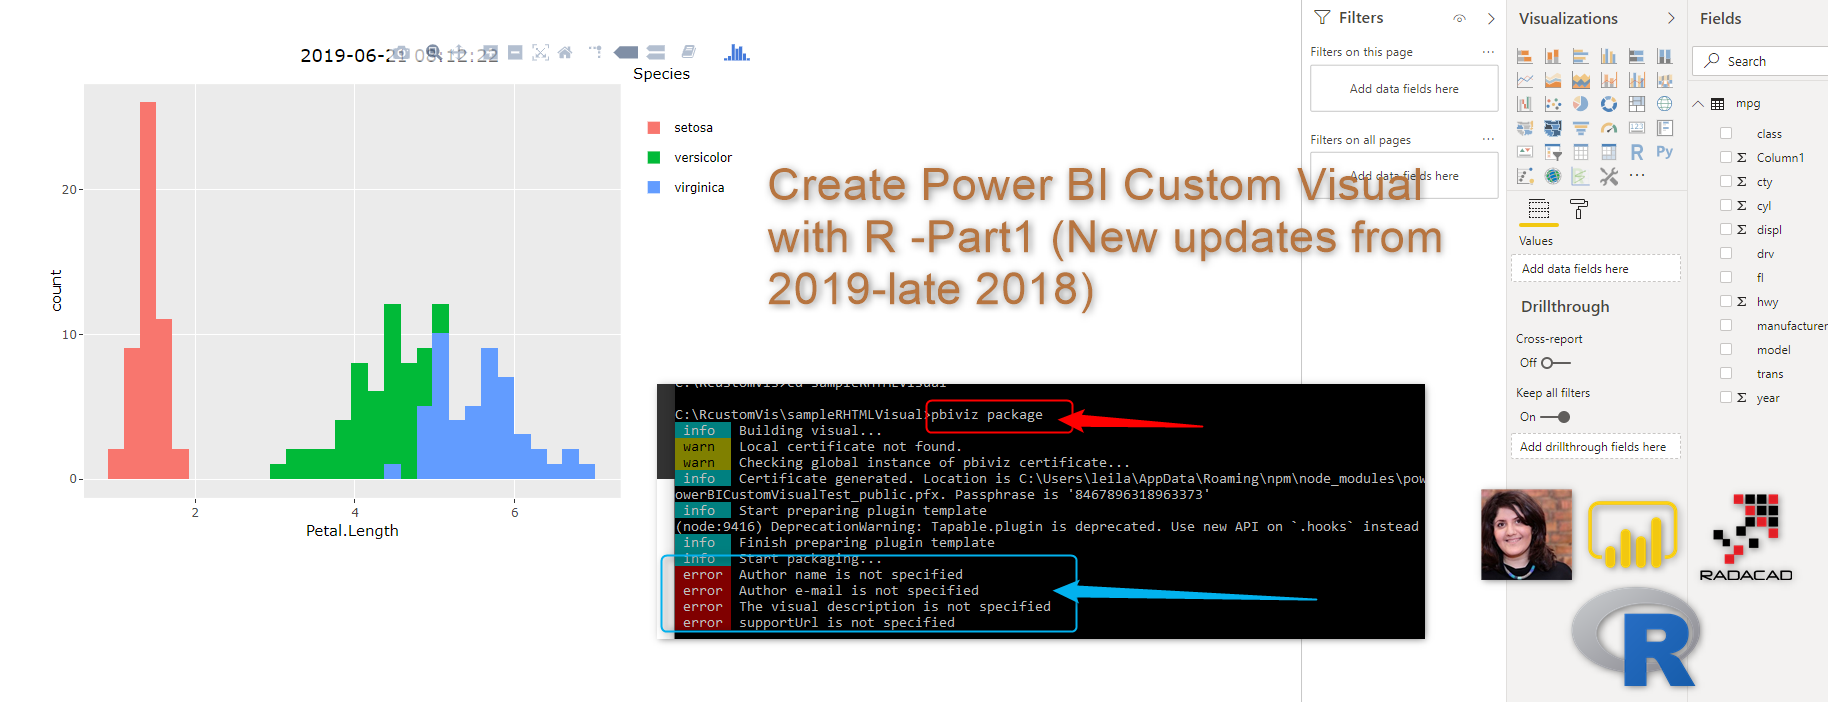
Interactive Charts using R and Power BI: Create Custom Visual Part 1
I am so excited about using Plotly packages in Power BI. So What is Plotly: is an R package for creating interactive web-based graphs via the open source JavaScript graphing library: https://plot.ly/r/getting-started/ this feature has been added recently and had been announce by Christian Christian Berg in Data insight summit 2017. I started to search about Read more about Interactive Charts using R and Power BI: Create Custom Visual Part 1[…]