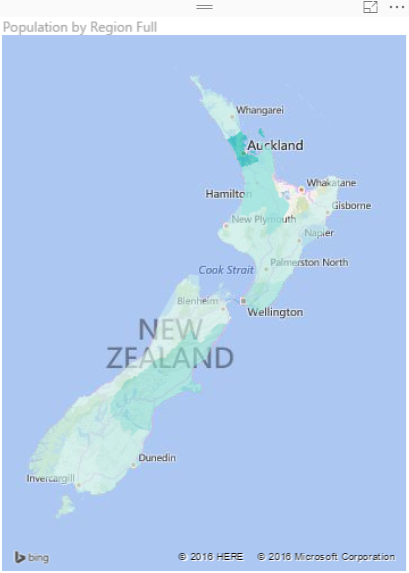
Power BI Filled Map; the Good, the Bad, and the Ugly

Power BI utilizes two built-in map charts; Map and Filled Map. Filled Map is a map that shows data points as Geo-spatial areas rather than points on map. Areas can be continent, country, region, state, city, or county. Working with Filled Map however isn’t as easy and convenient as the map chart is. You need Read more about Power BI Filled Map; the Good, the Bad, and the Ugly[…]

Power BI Q&A; How to Ask Questions?

In previous chapters of Power BI from Rookie to Rock Star you’ve learned that Power BI reports and models can be published in Power BI website for sharing, scheduling and some other purposes. One of the features in Power BI website which is unique to Power BI and is not available in many BI tools Read more about Power BI Q&A; How to Ask Questions?[…]

Custom Visuals in Power BI; Build Whatever You Want

In previous posts of Power BI from Rookie to Rock Star you’ve learned that Power BI has bunch of useful built-in visualizations such as bar chart, column chart, waterfall chart, tree map, and many other visualizations. However there is always requirement for new types of visualizations. You might want to visualize parts of the data Read more about Custom Visuals in Power BI; Build Whatever You Want[…]

SQL Saturday Melbourne; Presentation Materials

Thanks to all who attended on our pre-con, and sessions on SQL Saturday Melbourne. It was an awesome event, and we proud that we’ve been participating there at least as speakers. SQL Saturday Melbourne 2016 had 350 registrations. About 30 technical sessions, with the keynote from Mark Souza. Many international speakers as well as local. Read more about SQL Saturday Melbourne; Presentation Materials[…]

Webinar Materials Ready: Power BI Rises; Wonderful Things You Can Do

Thanks to all attendees to my webinar yesterday. It was pleasure to have you all attending in this session. I’ve uploaded session slides here and you can download them. Session was mostly demos rather than slides however. Unfortunately there was a technical issue and session didn’t recorded. I will get this recorded offline and upload Read more about Webinar Materials Ready: Power BI Rises; Wonderful Things You Can Do[…]

Power BI and Spark on Azure HDInsight; Step by Step Guide

Power BI can connect to many data sources as you know, and Spark on Azure HDInsight is one of them. In area of working with Big Data applications you would probably hear names such as Hadoop, HDInsight, Spark, Storm, Data Lake and many other names. Spark and Hadoop are both frameworks to work with big Read more about Power BI and Spark on Azure HDInsight; Step by Step Guide[…]

Be Fitbit BI Developer in Few Steps: Step 3 Visualization

In previous steps you’ve learned how to extract and mash up the data from CSV and automate the process of looping through all CSV files in the source folder. In this step we are going to build visualizations based on the data set we’ve built so far. In this post you will see how easy Read more about Be Fitbit BI Developer in Few Steps: Step 3 Visualization[…]

Be Fitbit BI Developer in Few Steps: Step 2 Loop Through All CSV Files

In the first step you’ve learned how to manipulate and mash up the data with few changes in Power Query M script. In spite of Power BI Desktop not being able to recognize your CSV file correctly because of the header row, you managed to write script and fetch data as you required. However this Read more about Be Fitbit BI Developer in Few Steps: Step 2 Loop Through All CSV Files[…]

Be Fitbit BI Developer in Few Steps: First Step Get Data from CSV

Power BI made things really easy, it isn’t hard to build dashboards and data analysis on almost any types of data sources. Previously in other sections of the online book; Power BI from Rookie to Rockstar I’ve mentioned few data sources and ways of connecting to them. In this post I like to show you Read more about Be Fitbit BI Developer in Few Steps: First Step Get Data from CSV[…]

Power BI Says Hi to 3D Maps

If you’ve read my previous articles about Power BI, you know that Power BI has five main components: Power Query, Power Pivot, Power View, Power Q&A, and Power Map. So far all of these components were now supported in PowerBI.com website as part of your Power BI solution except Power Map! Power Map was the Read more about Power BI Says Hi to 3D Maps[…]