
Compare Period Over Period Breakdown in Power BI Using the Waterfall Chart
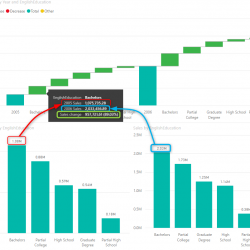
The Waterfall chart is a good visualization to show you changes on value over a sequence, The sequence can be time, or date or workflow steps, etc. There is also an ability in this chart that may not be visible to everyone, and that is the breakdown option of this chart. You can use the Read more about Compare Period Over Period Breakdown in Power BI Using the Waterfall Chart[…]