
I am excited about this blog post, this is based on the New service in Cognitive Service name “Anomaly Detection” which is now in Preview.
I recorded a video about how it works in cognitive service https://youtu.be/7ZOtZDbn6gM.
However, I am going to talk about how to use it in Power BI. In this post first, a brief introduction to the anomaly detection will be presented, then how it can be used inside Power BI will be discussed.
Anomaly detection
Anomaly detection is an approach in machine learning, that able to detect the rare data points, events or observation in the data that are different from the majority of the data. There are many algorithms that able to be used for this purpose. In Microsoft Cognitive Service they mainly used Spectral Residual (SR) and Convolutional Neural Network (CNN). The anomaly Detection in Microsoft is a time-series anomaly detection service. Check the Microsoft research article from here
Time Series Anomaly detection in Microsoft Cognitive Service Cognitive Service
to have an overview of how it works,
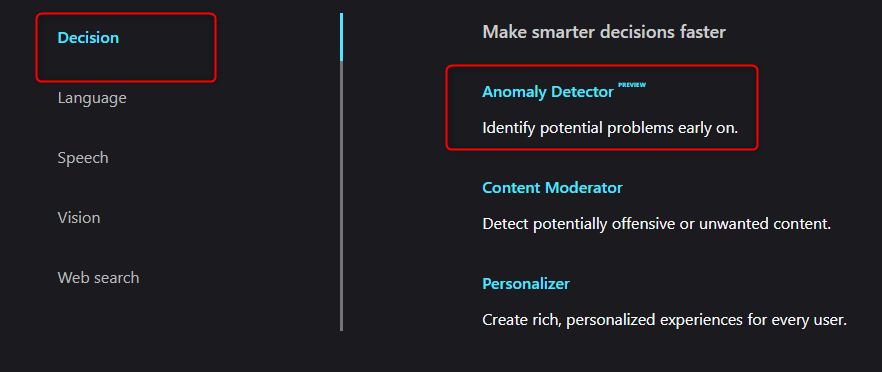
1- Navigate to https://azure.microsoft.com/en-us/services/cognitive-services/
2- under the decision click on the Anomaly detection
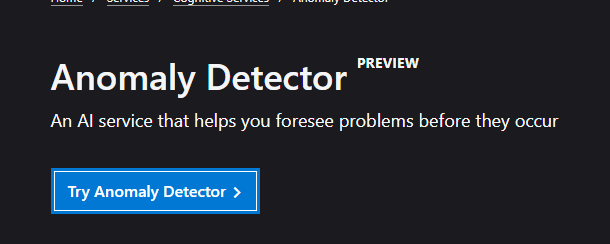
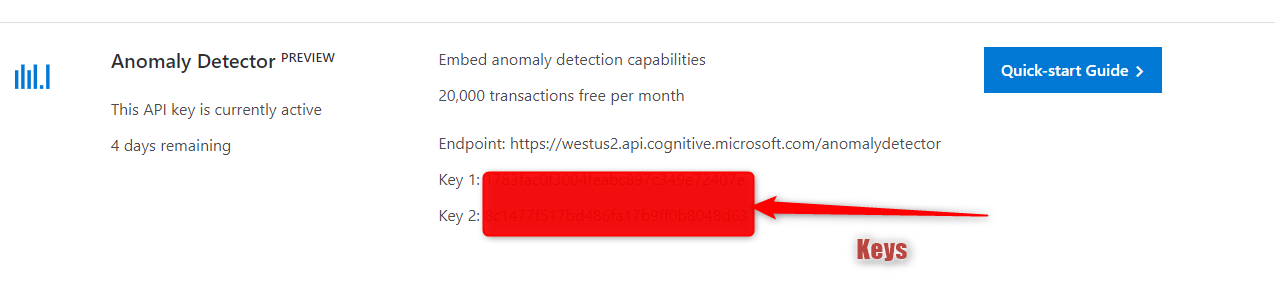
3- Click on the Try Anomaly detector to get the Key and endpoint
in the https://docs.microsoft.com/en-nz/azure/cognitive-services/anomaly-detector/ there is some great articles on how to use Anomaly detection.
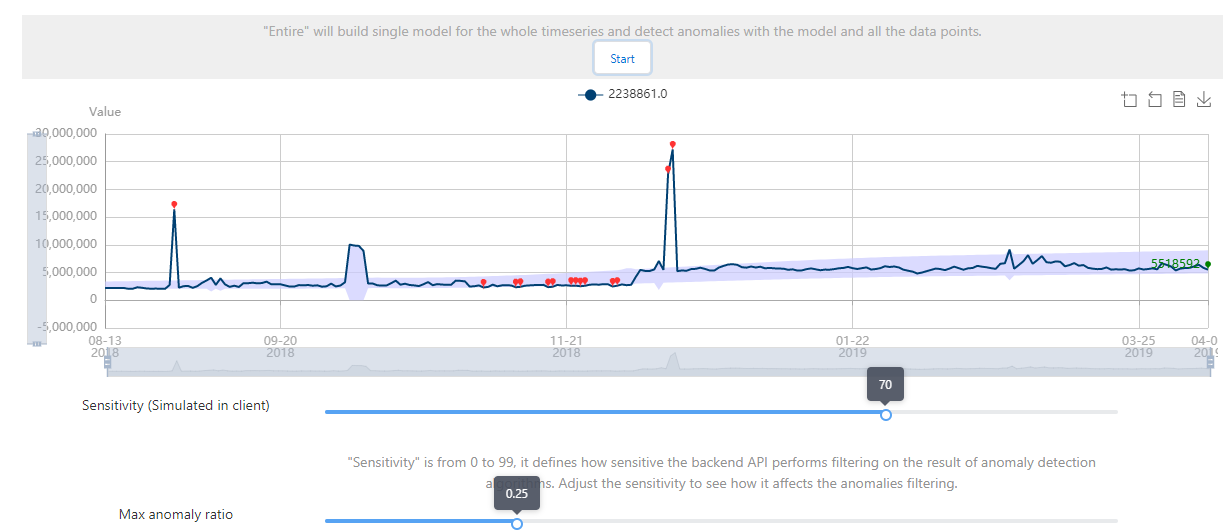
to see a live demo of Anomaly detection and how it works you can use the below link
https://algoevaluation.azurewebsites.net/#/
also, I have recorded a video on how to use it in RADACAD channel
Power BI and Time Series Anomaly detection
there is a document in the Microsoft webpage about how to connect to the API of Anomaly detection, which was a big help, but I have to change some part of the code to make it work as I though the API of the anomaly detection change as it is in Preview, so I have to change the M code to make it work, but in future also this one may change as well if the API change to make sure it works need to check the input JSON data. Thanks to Reza Rad to help me in some part of this process 🙂
This the original great blog post that I change it to make work with new API
so what we need
Data
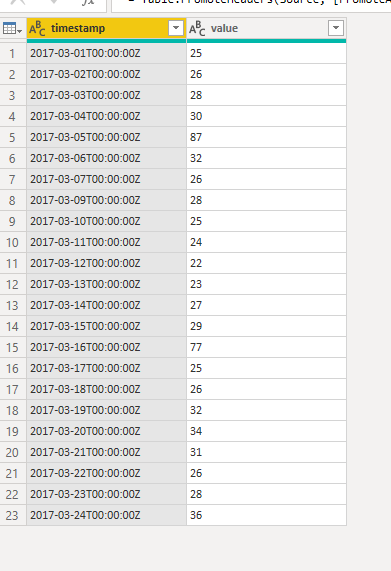
there is a specific format of data that you can use
it should be two columns, one is for the date with the name “timestamp”, the other one is “value”
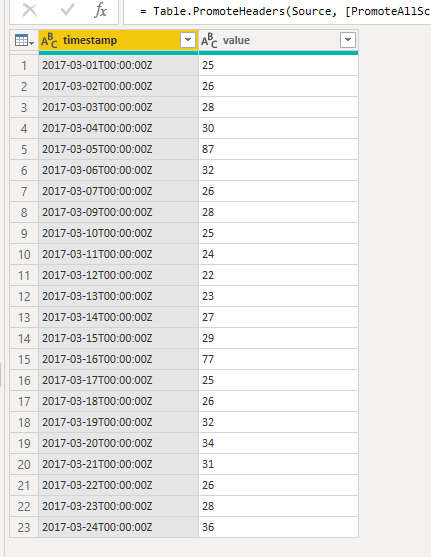
This is the specific format for the time
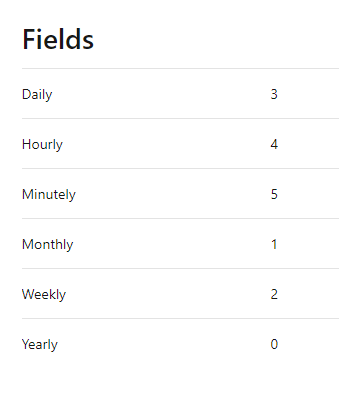
in my scenario, it was the daily data, so in the API we have a field name granularity, so the form was daily.
| 2017-03-01T00:00:00Z |
use this dataset for your demo also
Function for calling The API
now we need to create a function to call the API,
need to go to the Power Query Editor
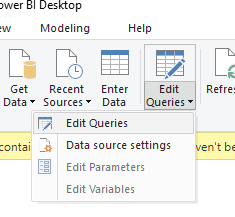
Then in the Query list create a new Query and Blank Query
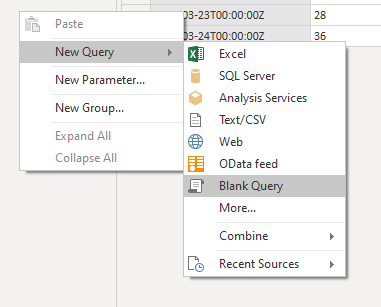
Then click on the Advanced Editor to paste the below code
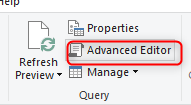
The in the new Query Editor, remove everything and paste the code
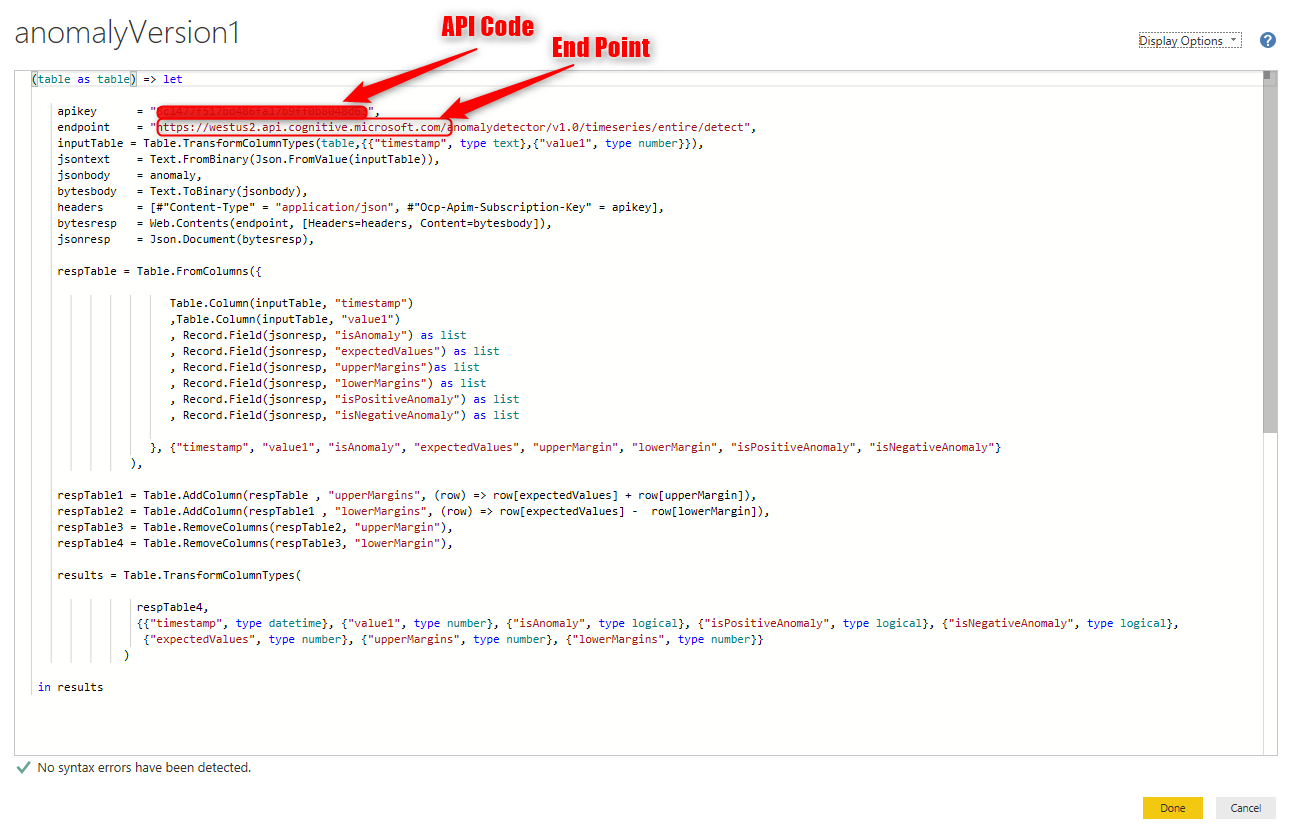
the above code is here, ( check the image as the format may change while copying from here)
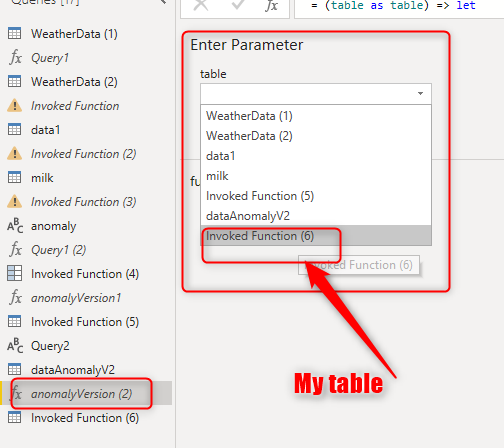
(table as table) => let
apikey = “Your API Code”,
endpoint = “https://westus2.api.cognitive.microsoft.com/anomalydetector/v1.0/timeseries/entire/detect”,
inputTable = Table.TransformColumnTypes(table,{{“timestamp”, type text},{“value1″, type number}}),
jsontext = Text.FromBinary(Json.FromValue(inputTable)),
jsonbody = anomaly,
bytesbody = Text.ToBinary(jsonbody),
headers = [#”Content-Type” = “application/json”, #”Ocp-Apim-Subscription-Key” = apikey],
bytesresp = Web.Contents(endpoint, [Headers=headers, Content=bytesbody]),
jsonresp = Json.Document(bytesresp),
respTable = Table.FromColumns({
Table.Column(inputTable, “timestamp”)
,Table.Column(inputTable, “value1”)
, Record.Field(jsonresp, “isAnomaly”) as list
, Record.Field(jsonresp, “expectedValues”) as list
, Record.Field(jsonresp, “upperMargins”)as list
, Record.Field(jsonresp, “lowerMargins”) as list
, Record.Field(jsonresp, “isPositiveAnomaly”) as list
, Record.Field(jsonresp, “isNegativeAnomaly”) as list
}, {“timestamp”, “value1”, “isAnomaly”, “expectedValues”, “upperMargin”, “lowerMargin”, “isPositiveAnomaly”, “isNegativeAnomaly”}
),
respTable1 = Table.AddColumn(respTable , “upperMargins”, (row) => row[expectedValues] + row[upperMargin]),
respTable2 = Table.AddColumn(respTable1 , “lowerMargins”, (row) => row[expectedValues] – row[lowerMargin]),
respTable3 = Table.RemoveColumns(respTable2, “upperMargin”),
respTable4 = Table.RemoveColumns(respTable3, “lowerMargin”),
results = Table.TransformColumnTypes(
respTable4,
{{“timestamp”, type datetime}, {“value1”, type number}, {“isAnomaly”, type logical}, {“isPositiveAnomaly”, type logical}, {“isNegativeAnomaly”, type logical},
{“expectedValues”, type number}, {“upperMargins”, type number}, {“lowerMargins”, type number}}
)
in results
This code is a bit different from Microsoft documents to support the API.
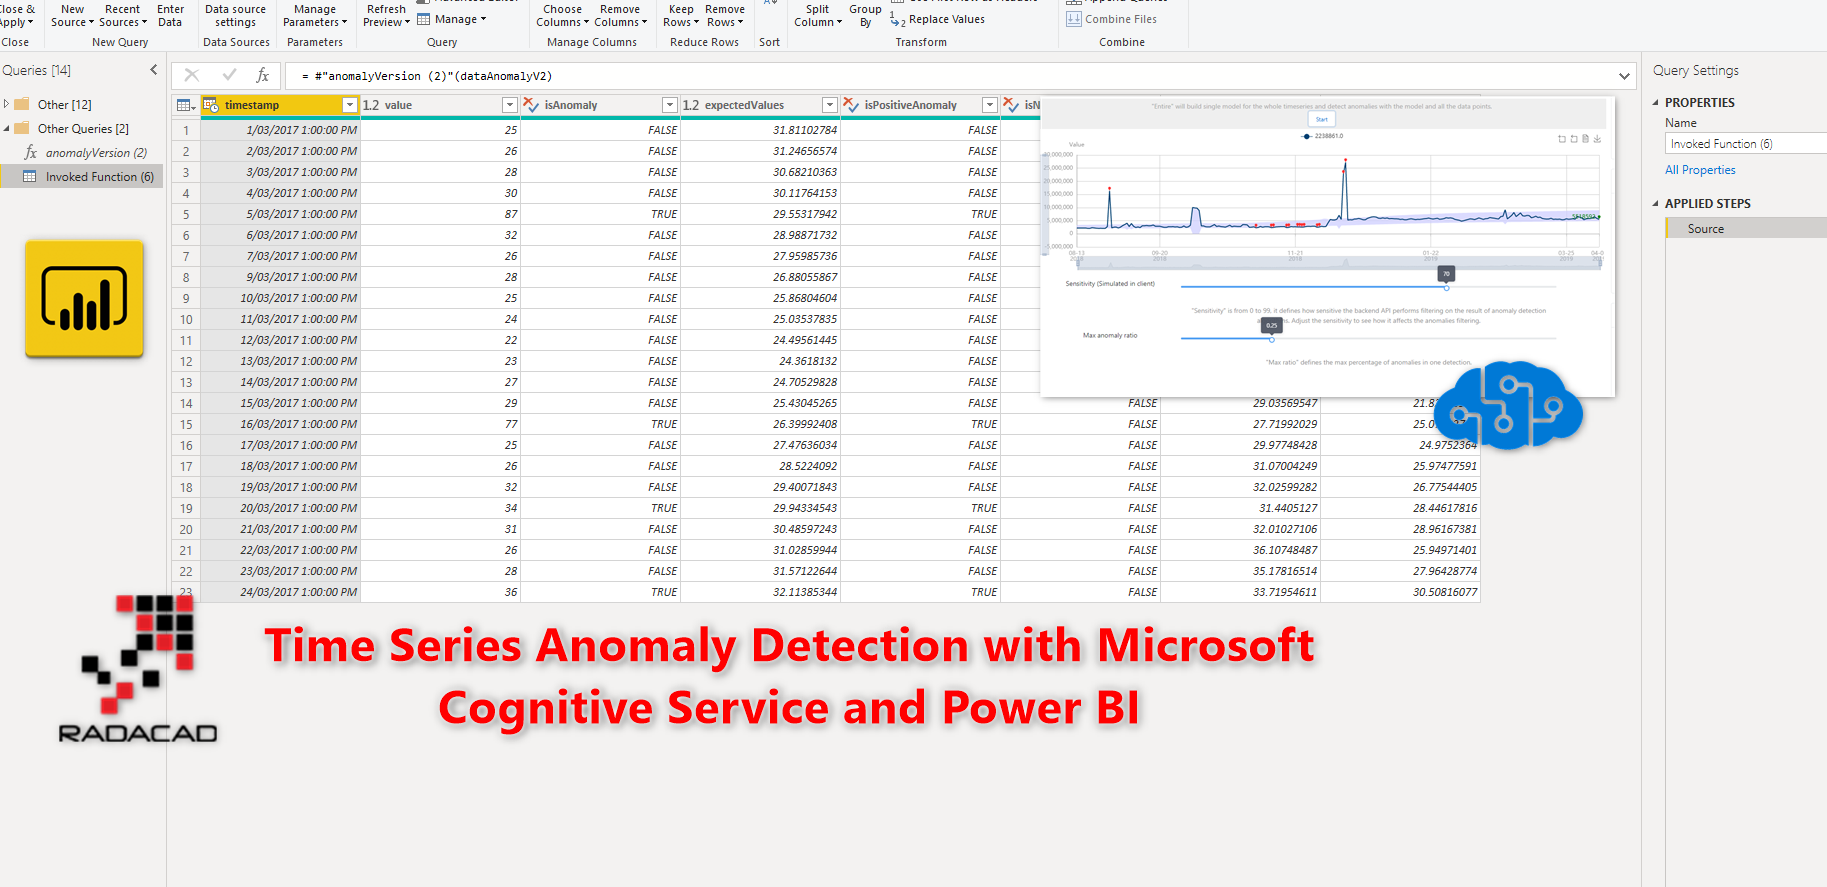
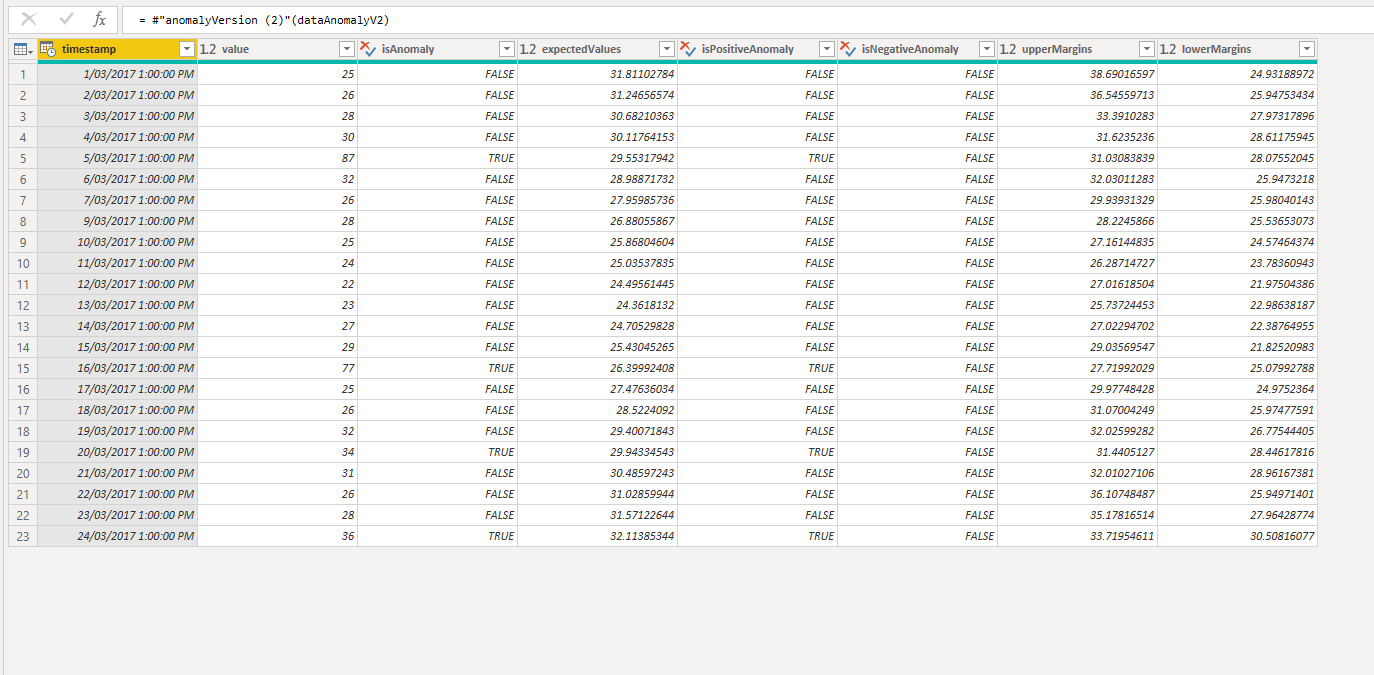
Now you should see the below result.
the original data in the first two columns, then the boolean column to show is anomaly happen or not, then expected value.
the ISPositiveAnomaly and IsNegativeAnomaly
Attention
This is the Preview service so the API can change, What I recommend to make the above code updated is to check the JSON code in the Demo page
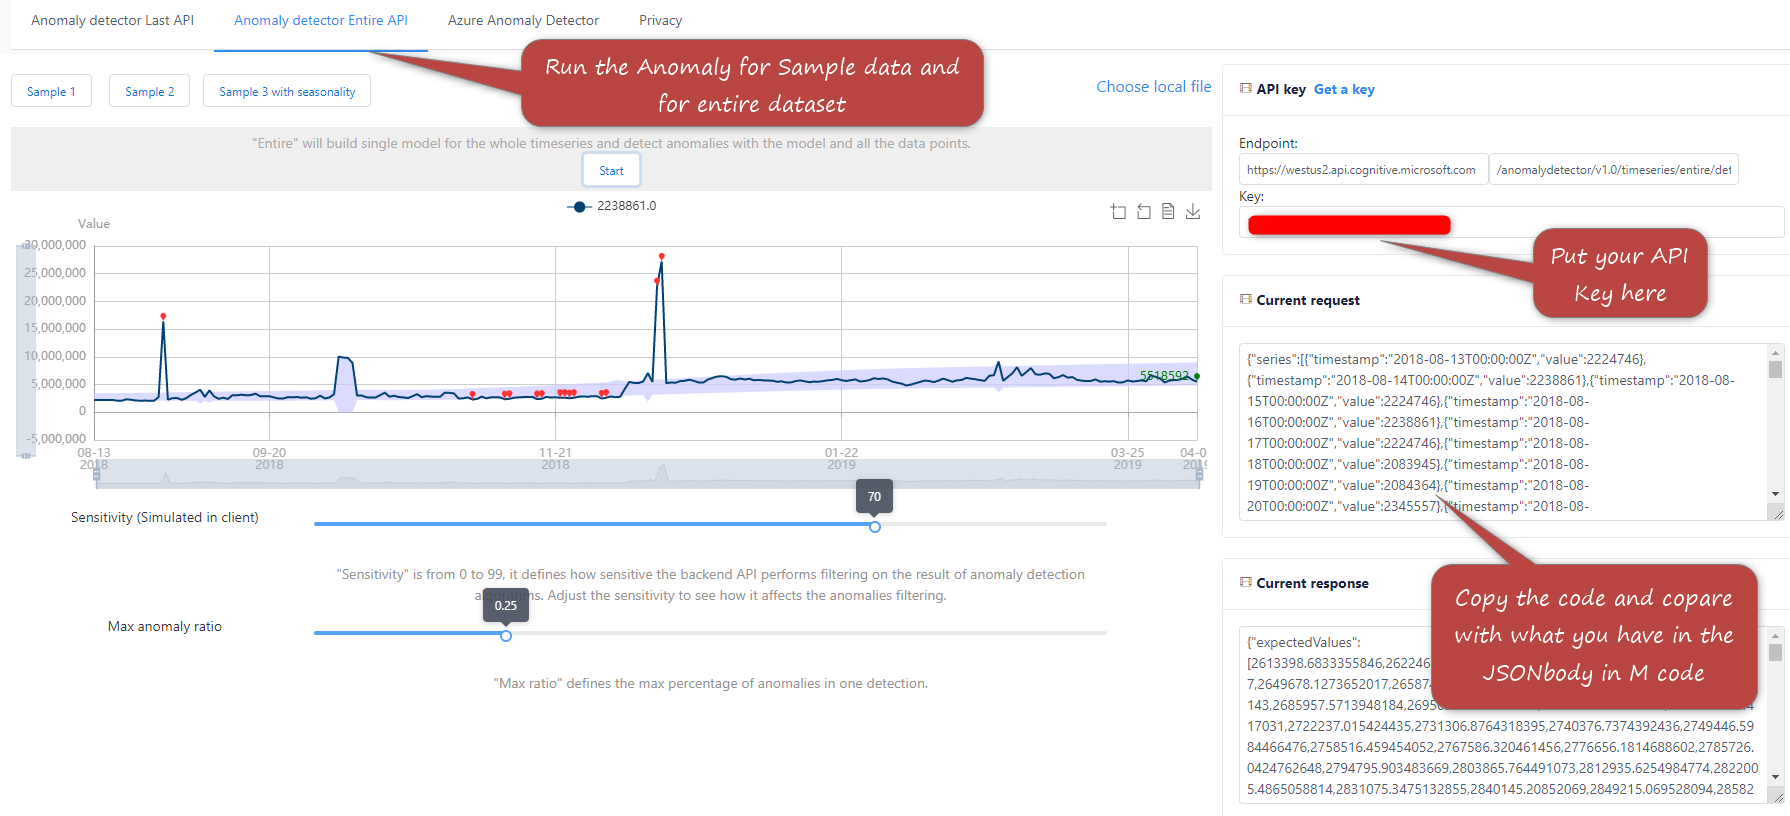
I will create a video of this process soon to make it clear


