
Power BI is the new self-service BI tools introduced by Microsoft. Power BI comes as part of Office 365 and Excel tools as some Add-Ins. Power Query is one of the main components of Power BI, and the functionality of Power Query is for self-service data transfer and ETL. In this blog post I’ll describe what is the Power Query with a sample demo of how it works. More Power Query posts would be written under this blog category here.
What is Power Query?
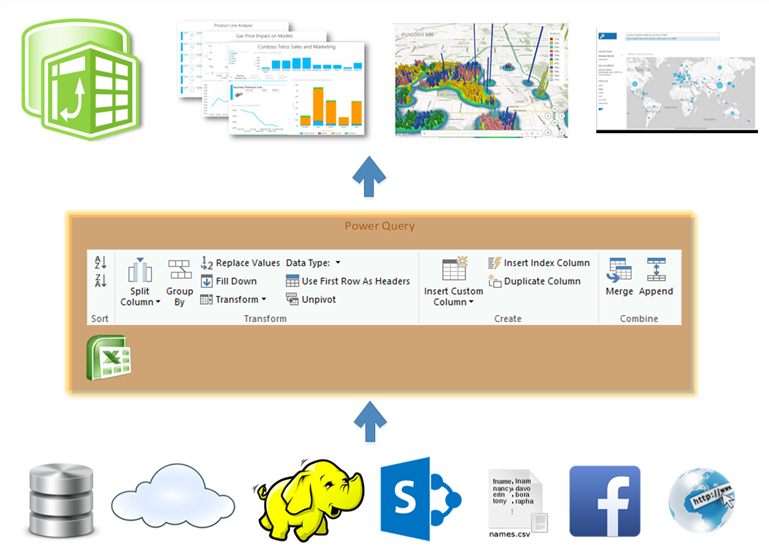
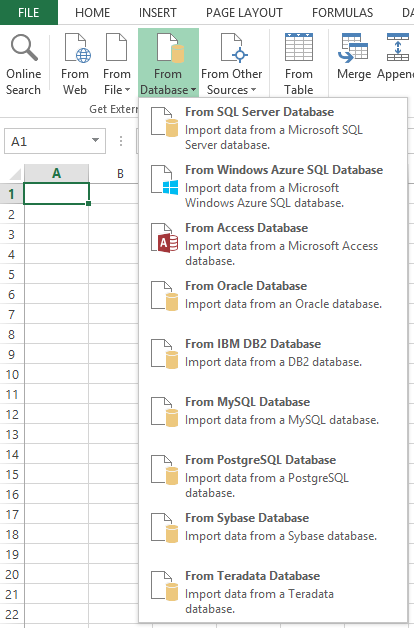
As the diagram above shows; Power Query connects to wide range of data sources. Databases such as SQL Server, Oracle, DB2, …, Text files, Big data and Hadoop data sources, online searches and OData feeds, Cloud storage, Facebook, SharePoint, and many other types of data storage can be used as the data source for Power Query. Power Query extract the data from sources, and do transformations such as; splitting columns, data conversions, lookups, merge, append, and many other data transformations. Power Query introduced a new expression language called "M" for data transformations. Data result set of Power Query transformation can be loaded into PowerPivot tabular model, and it can be used in Power View or Power Map for data visualization. Power Q&A is also another component of Power BI which uses the result set to generate intelligence based on existing data.
Power Query comes with two editions; Standalone edition, and Power BI edition. the Power BI edition at the moment is the preview edition and the final product will be released soon. With the standalone edition of Power Query you can extract data from data sources listed above, you can transform data, share result set and use it in other products. The main advantage of Power Query for Power BI edition, is the ability to share queries through users, which helps making more robust, rich, and helpful queries. through the online search of standalone edition you can search through public data such as data from Wikipedia, but with Power BI edition, you are able to search through organization information as well.
For using Power Query you would require to install Power Query Add-In, which can be downloaded from here*:
http://www.microsoft.com/en-nz/download/details.aspx?id=39933
* This is the link to most recent version up to the time of writing this blog post. Power Query version for this release is 2.9.3547.162, which published in 16th of Jan 2014.
After installing Power Query for Excel, Open an empty excel workbook. you will see the Power Query menu item with sub menu icons under it.
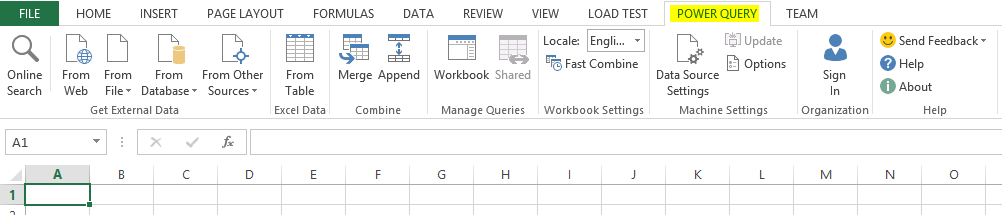
in the "Get External Data" menu section you can see list of variant data sources supported by Power Query. data sources can vary from internet urls, to databases, flat files, SharePoint lists, and other data sources that illustrated below.
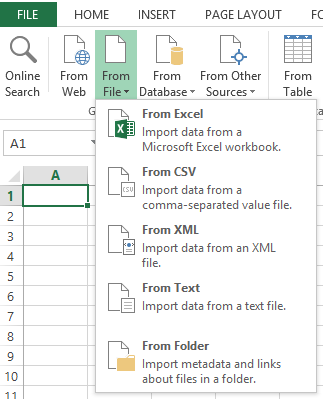
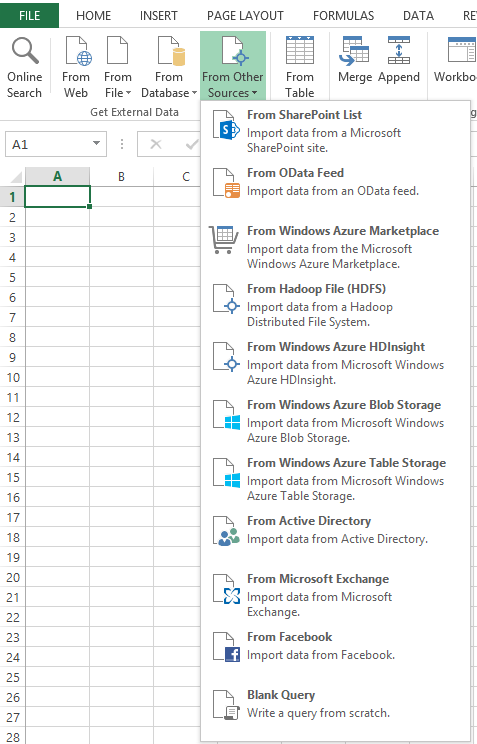
Data from an excel sheet can be used as a source as well (with choosing "From Table" menu item under "Excel Data" section).
Basic Example of Power Query
In this section I like to introduce some features of Power Query and some of very basic "How To"s of this tool with a sample. the sample that I introduce here is populating ranking of most popular movies based on IMDB user reviews, and comparing this with highest grossing and also most awarded movies. I’ll use online data from websites and online searches in this example.
follow below steps for this example;
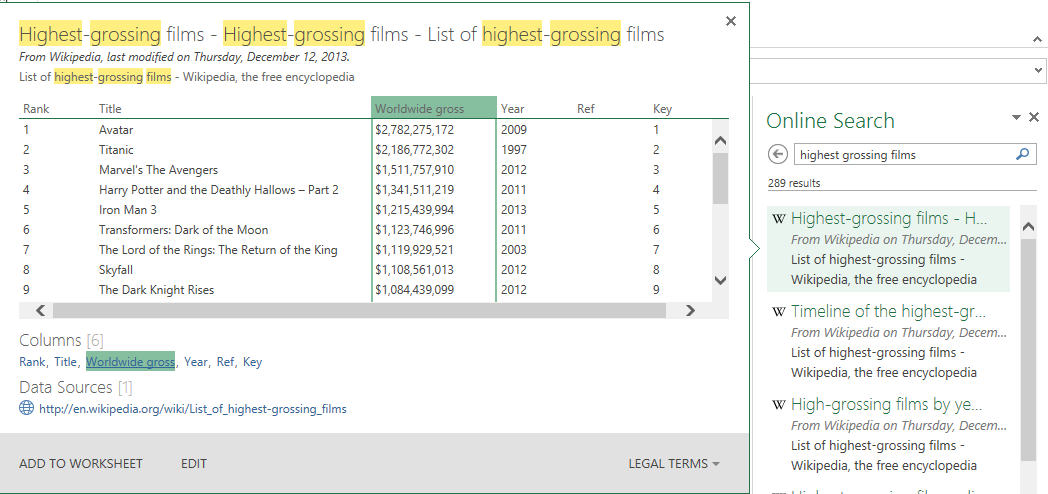
1- Open and empty workbook in Excel, go to Power Query tab, click on Online Search. you will see the online search pane appears in the right hand side. type "highest grossing films" in the text box and click on search. you will see list of search result. if you hover mouse on any of search results you can see the detected data set in that online page. screenshot below shows the detected data set of one of Wikipedia pages that shows highest grossing films of all times updates in December 2013. in the Preview pane you will see some rows with columns, if you select on any of columns that column would be highlighted.
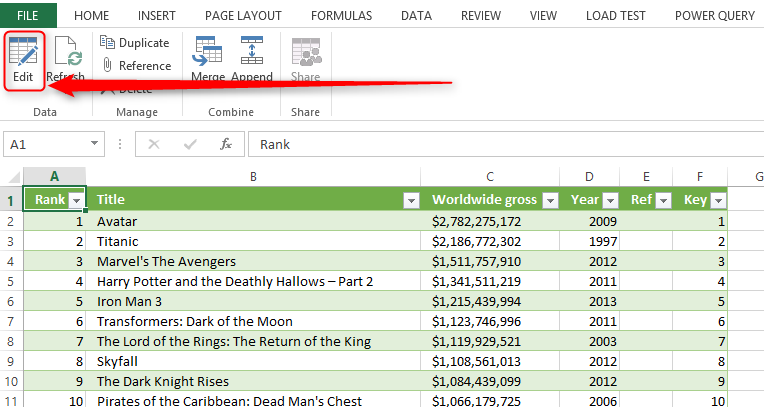
2- Click on Add To Worksheet in the preview window from previous stage. the table will be populated into Excel. As you’ve seen in this step Power Query is pretty effective in fetching data tables from online resources such as Wikipedia. If you want to have the ability to search through organizational data with this online search option as well, you require Power BI edition of Power Query.
3- Click on the Edit menu item, as it shows in following screenshot. this enables you to edit data in Power Query editor window.
4- the Query Editor window opens, you will see the Power Query Editor designer window. this editor is the development editor that you will spend most of your times on it when you work with Power Query. screenshot below shows different sections in this editor with numbers.
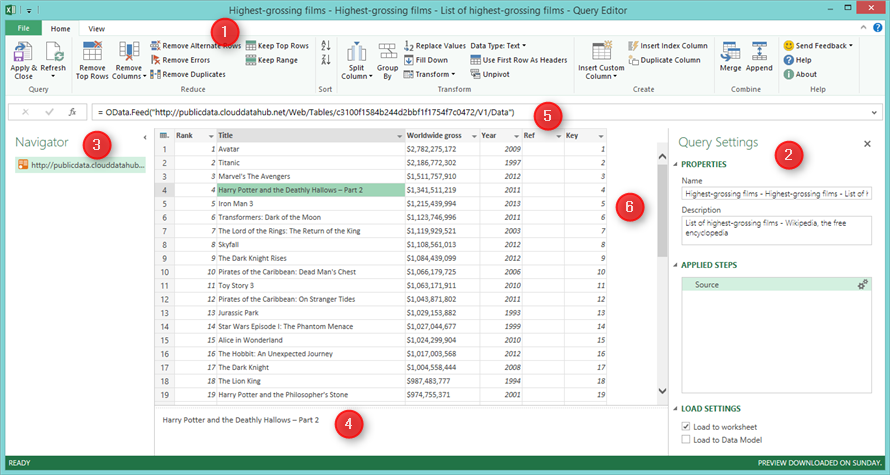
sections in the image above described as below:
- Editor Menu; this section shows menu options for editing the dataset. Options such as splitting, creating custom columns,…
- Query Settings; this section contains Query properties, Applied steps on the dataset, and loading options (data can be loaded into excel sheet or into the a tabular data model in Excel, or it can be loaded into excel sheet as we’ve done in this example)
- Navigator pane; this pane shows datasets under a data source in hierarchical structure. for example if you have more than one datasets under a web url, you will see them here in Navigator pane.
- Description pane; this pane shows description of the cell or record selected in the main pane (section 6)
- Formula Bar; this section shows the expression generated/written to transform/populate the data. Power Query uses an expression language called "M". "M" can be written manually in the formula bar, or it would change with applying any of menu options (section 1) on the dataset.
- Dataset pane; this is the pane that shows you preview of dataset after applying changes by menu options or formula in Formula Bar.
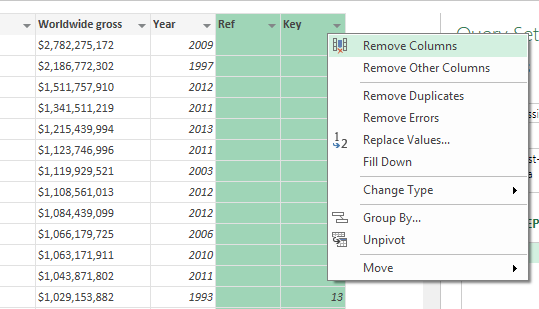
5- in the Dataset pane, select Key and Ref columns (last two columns), and right click on column header and remove those columns.
6- You can see datatype of each column in dataset, with right clicking on the column’s header and going to Change Type sub menu, as illustrated in below screenshot:
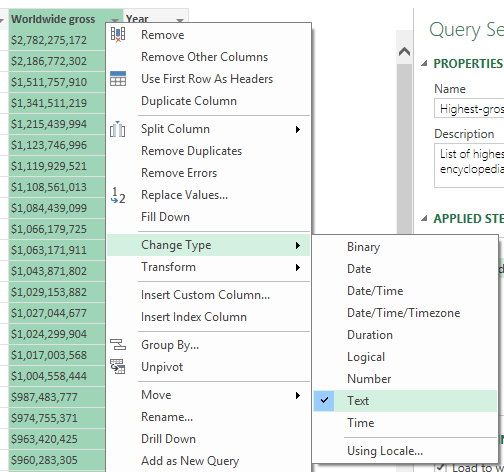
As you see in above screenshot, Power Query supports most of basic data types.
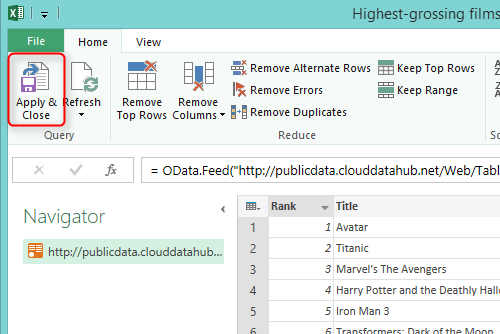
7- Click on Apply & Close option to save results into the excel sheet.
8- From this step I’ll populate another dataset from IMDB website (which is a movie directory website) to fetch list of top 250 movies based on this website’s user ranking. this website has a url for top 250 movies that showed below:
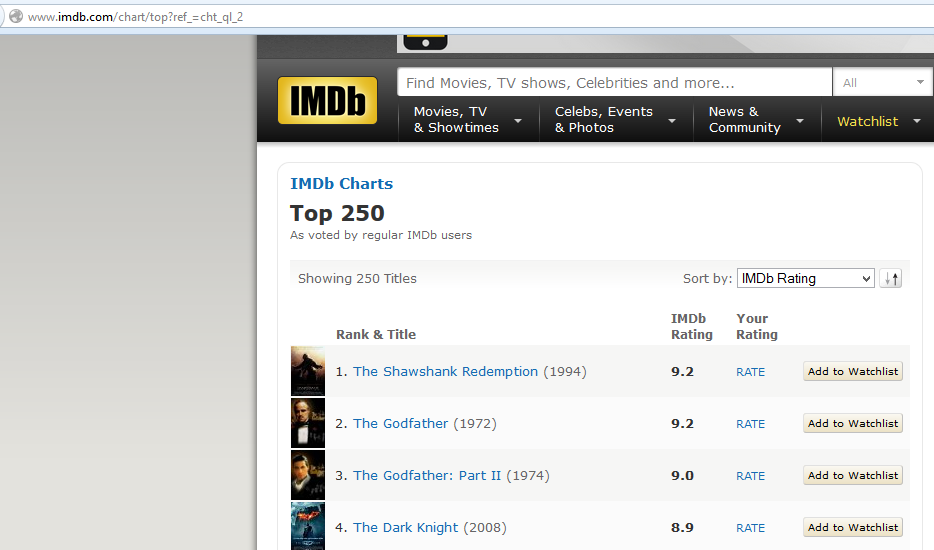
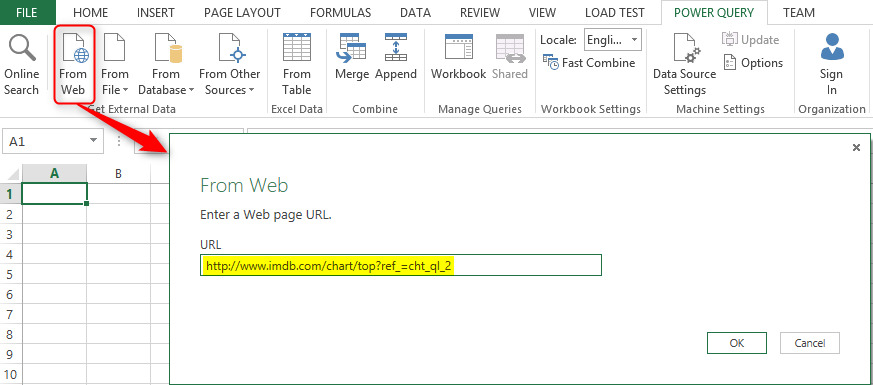
9- Go to Power Query tab in Excel. Click on "From Web" option, and in the "From Web" dialog box, enter the page url as: http://www.imdb.com/chart/top?ref_=cht_ql_2
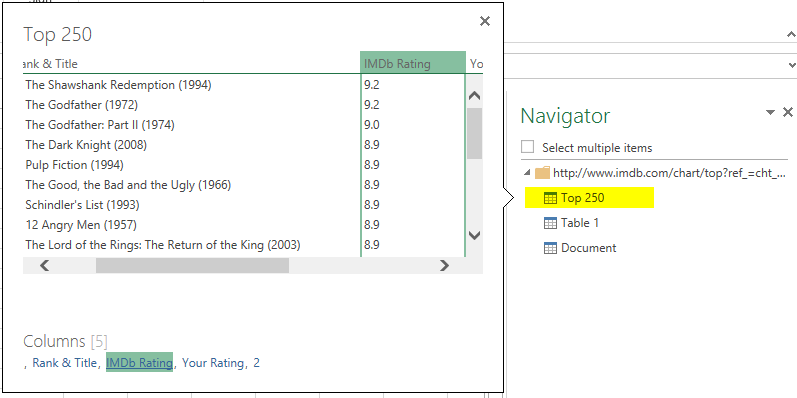
10- After clicking on OK in the dialog box, you will be redirected to Navigator pane in the right hand side of the Excel. the Navigator pane shows you all dataset detected by Power Query in that page url. Click on the Top 250 table and load the dataset into Query Editor designer.
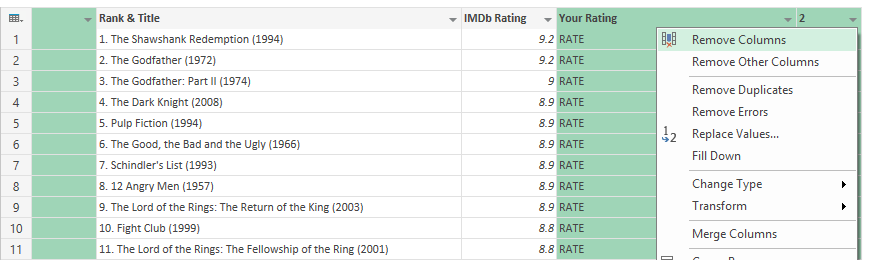
11- Remove three extra columns as illustrated below
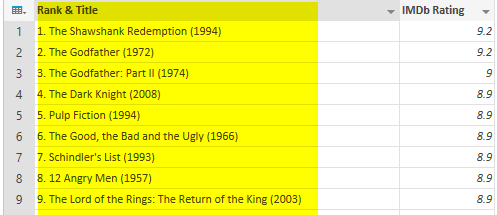
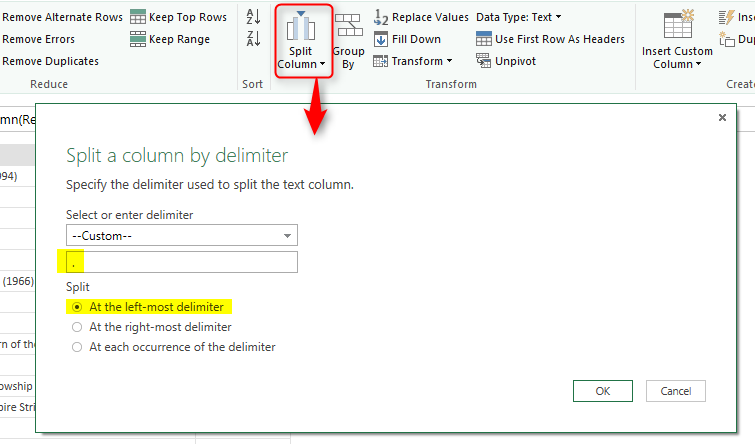
12- Now we want to fetch out the Title of movie out of the column that contains ranking, title, and year. As you see in screenshot below the separator between rank and title is a single dot (.).
13- Click on the Rank & Title column, and then click on Split Columns by Delimiter. in the "Split a Column by Delimiter" dialog box, select delimiter type as Custom, and type in the "." in the text box. then choose the split mode as "At the left most delimiter". the reason for choosing this option is that there might be more than single dot in this column’s value, because there might be a movie with a title that contains "." character.
14- After splitting you will see two columns named as Rank & title 1, and Rank & Title 2. the first one now contains only the rank, the second one contains Movie title and year. right click on the first column and rename it to Rank.

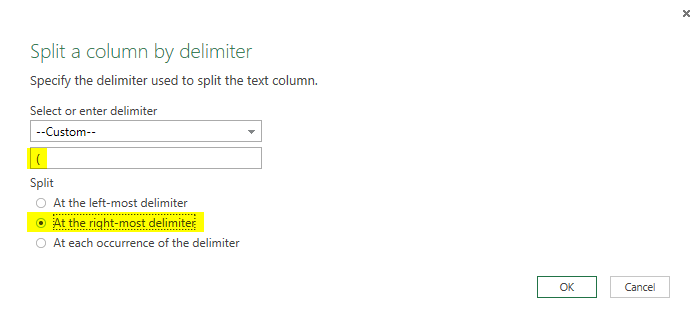
15- Click on Rank & Title 2 column, and split it by delimiter. choose Custom delimiter, and type in "(" as the delimiter. then choose the split mode as "At the right most delimiter".
16- After applying split, "Rank & Title.2.1" column would show only the Title, and "Rank & Title.2.2" would show the year with an extra ")" character.
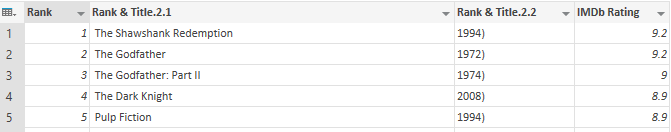
17- rename the "Rank & Title.2.1" column to Title.
18- Click on "Rank & Title.2.2" and then click on Replace Values, fill the Replace values dialog box as below screenshot illustrated
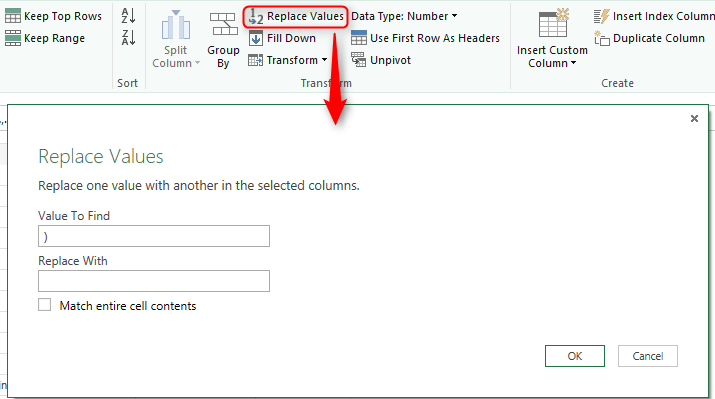
19- after replacing values you will see only the year value with no extra character in "Rank & Title.2.2" column, rename it to Year.
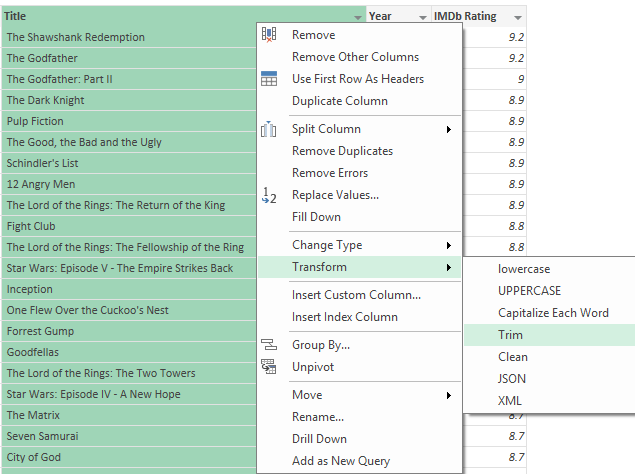
20- Right click on the Title column and under Transform select Trim. (this would remove extra spaces from the beginning and end of the values)
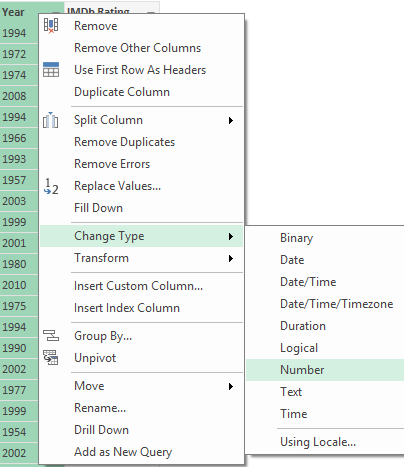
21- Right click on Year column and change its data type to Number as below screenshot shows;
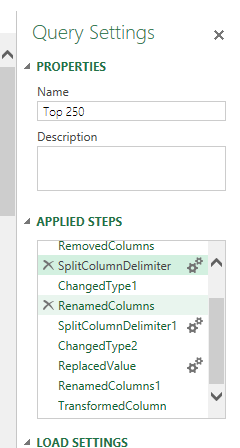
22- Now we have our IMDB rating dataset transformed and ready to be loaded into the excel sheet. before loading that to the excel sheet note the Query Settings pane, and the Applied Steps section under that. Here you see a list of steps that we applied to the dataset. if you click on a step, you will see the output dataset for that step. if you want to remove a step from transformations you can simply click on delete icon in the left hand side of that item in list (Don’t do that for this example now)
23- Apply and close dataset to be loaded into excel sheet.
24- Go to Table Tools tab, and then go to Query tab, choose Merge, and configure Merge option as below screenshot shows.
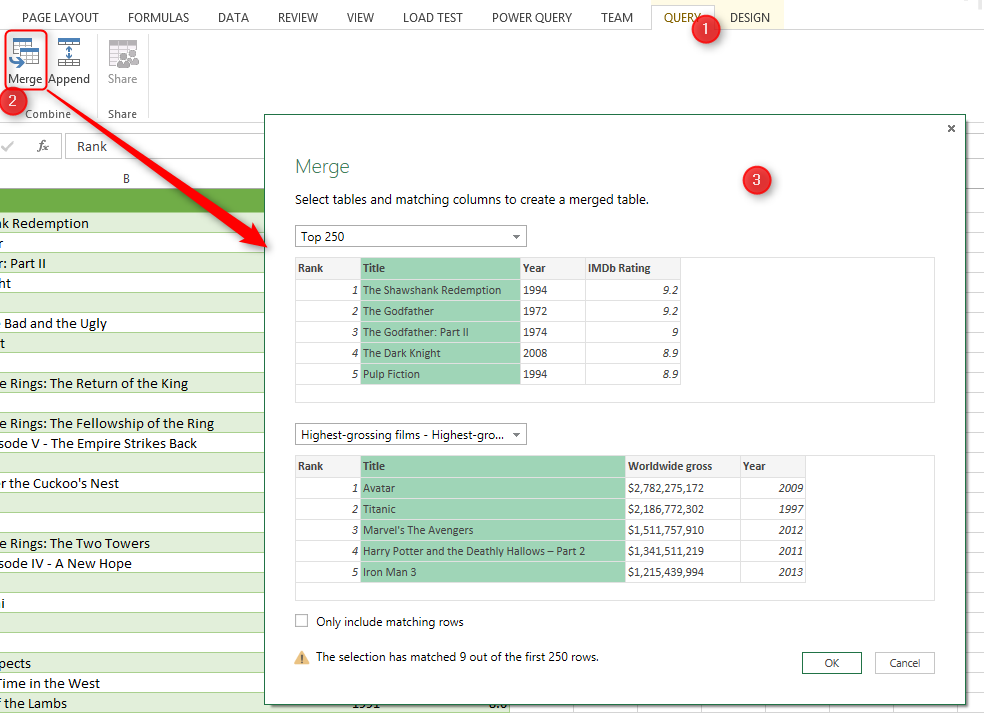
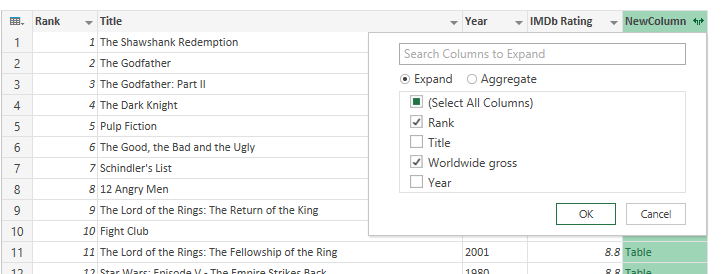
25- After applying Merge you will see the result dataset loaded into Query Editor window. click on last column’s header, and choose only Rank and Worldwide gross from list of columns.
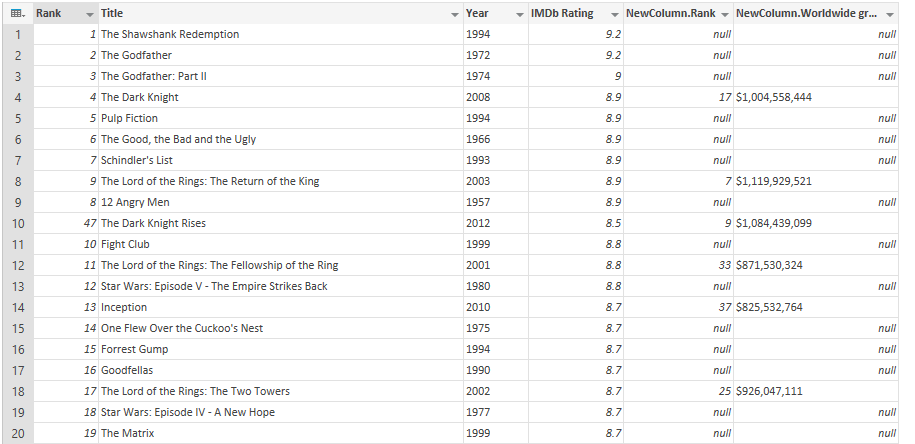
26- As the result you see that some records matched between two data sets, and you see also that not all the best user rated movies gained the highest worldwide gross sales.
Summary
This was a very basic sample of Power Query. In this sample you’ve learned how to work with Power Query, how to load data from online search and also a web url, you’ve learned how to apply transformations such as changing data type, splitting column, replacing values to a dataset. you’ve learned about Power Query Editor sections. In next blog posts I’ll dive more in the deep of Power Query and especially the "M" formula language.


Reza is author of more than 14 books on Microsoft Business Intelligence, most of these books are published under Power BI category. Among these are books such as Power BI DAX Simplified, Pro Power BI Architecture, Power BI from Rookie to Rock Star, Power Query books series, Row-Level Security in Power BI and etc.
He is an International Speaker in Microsoft Ignite, Microsoft Business Applications Summit, Data Insight Summit, PASS Summit, SQL Saturday and SQL user groups. And He is a Microsoft Certified Trainer.
Reza’s passion is to help you find the best data solution, he is Data enthusiast.
His articles on different aspects of technologies, especially on MS BI, can be found on his blog: https://radacad.com/blog.
THANK YOU SO MUCH MR REZA
VERY USEFUL FOR ME