

The Breaking news of General Availability of Power BI 2.0 in now everywhere all around the world. In this post I’ll illustrate some great new features of Power BI. if you would like to see a real world example of Power BI you can read FIFA 2014 Worldcup Data Analysis with Power BI, I’ll update that example later on with the new Power BI version. It has been a while that Power BI was on Preview, and with the great effort from Microsoft product team it is now available fully released. As per Microsoft blog post on 21st of July 2015 Microsoft mentioned some great features that will be available in this release, in this post we will go through them one by one.
Power BI Desktop
The very first change that will catch your eyes in the first glance is the name change of Power BI Designer to Power BI desktop with the new look and feel.

As you see in the Power BI Desktop smart window below there are three new features; Recent Sources added in the Left Section (numbered 1 in the screenshot below) to access the most recent solutions. New set of videos updated with the new version of Power BI (numbered 2 in the screenshot). and link to community forums community.powerbi.com for you to ask questions and get responses (numbered 3).

New Data Connectors
There are six new data connectors added to Power BI as listed below. you can access these through Get Data menu option, and then clicking on the Other tab of the Get Data Dialog box.
- appFigures
- QuickBooks Online
- Zendesk
- GitHub
- Twilio
- SweetIQ

You Can Still Work with Your Power BI Designer *.pbix Files
Don’t be panic, the new Power BI Desktop supports all Power BI Designer files that you’ve created before. simply just follow the File menu option, and click Open, and you will be able to select any *.pbix file and continue development of that in the new Power BI Desktop.

New Query Editor Window
The previous experience with Power BI Designer opened Power Query as a tab in the designer itself which was a bit different from the Excel version of Power Query in terms of look and feel. In the Power BI Desktop if you click on Query Editor you will be directed to a new Query Editor window with the same look and feel of the Power Query window.

Power BI Desktop and Query Editor Window Fully Interactive
The new Query Editor window in a little bit different from the Power Query editor window. The difference is the way that you interact with it. In Power Query for Excel, when you open Power Query window then you no longer has access to main Excel window, and you should do your work on Power Query, and then close it, to be able to access to Excel functionality. Fortunately that problem doesn’t exist in Power BI Desktop you can have Power BI Desktop fully interacting with the Query Editor window open and working. Great! I wish this feature soon be available in Power Query for Excel as well.
Previous Data Tab still there!
Well with the new Query Editor window and all functionality for data transformation available there, I’m still amazed why the previous data tab is still available. I reckon this will go away in next updates of Power BI soon. This window at the moment is more type of a view of data modeled in the solution. you can also create new calculated measures from here.

New Query Transformations
Extract First/Last/Range of Characters from a Text Column
You can now specify number of characters that you want to fetch from a text column, the number of characters can be from the first, last, or a range of it. To use this feature you can find it in two locations below in the Query Editor window:
- Transform Tab; under Text Column, click on Extract, and choose from one of the options

- Add Column Tab; under Text Column, Click on Extract, and choose from one of the options

With choosing any of options above, a dialog box will appear and asks for number of characters

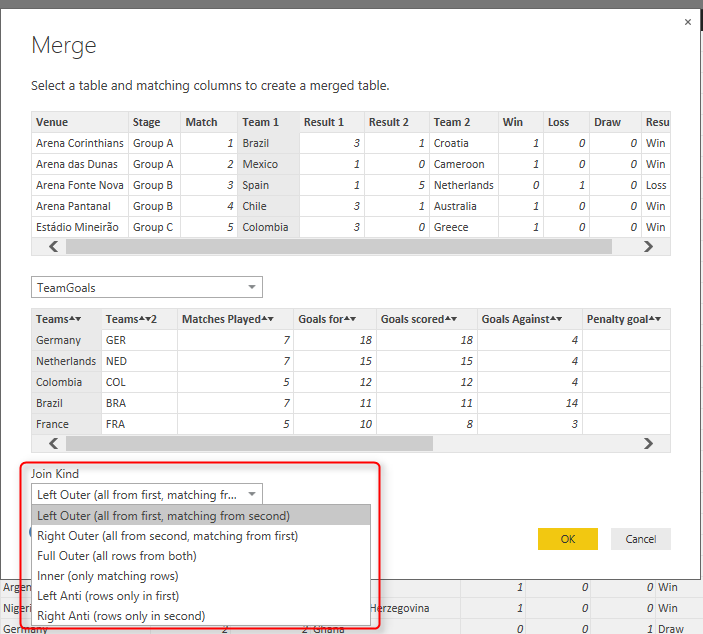
Specifying Join Type in Merge Queries Dialog box
Great! If you have been in my Power Query session in SQL PASS Summit 2014, you’ve seen my demo of using different join types in M scripting query, the reason was that this functionality was not available in the GUI. But here is the great news, now in Query Editor you can change Join Type within the graphical designer. I would like to see more and more M features comes through the designer.
You can choose one of following Join Kinds:
- Left Outer (all from first, matching from second): this option was the default behavior previously within Merge dialog
- Right Outer (all from second, matching from first)
- Full Outer (all rows from both)
- Inner (only matching rows); this option was available previously through “Choose only matching rows” option in Merge dialog
- Left Anti (rows only in first)
- Right Anti (rows only in second)
Customizing Quote Style in Split Column by Delimiter Dialog
Quote is the surrounding characters of the values. Usually in CSV files you have a column separates (commonly it is comma, but it might be anything else), So if one of the columns has a separator inside the value column (like address like: Meadowbank, Auckland). then you will face some issues when you are about to split that column by comma delimiter. so usually a quote will be placed around column values, and that quote will be considered at the time of split column.
the Split Column dialog box now has option to choose if your columns are quoted or not. However this only support quote (“) as the surrounding values not other characters. I expect this option be more flexible in next updates.

New Visualization
This is the major part of Power BI Desktop release, there are four new visualization elements:
- Area Chart
- Waterfall Chart
- Donut Chart
- Matrix
Here is an example Donut Chart

Waterfall chart

Matrix

Area Chart

New Formatting
You can now set options such as background, labels, colors, and legend
You can now customize look and feel of charts and visualization elements. as an example here is how you can set legends:
you can set title of legend. and you can set the position of legend.

You can also customize colors. Yaay! Finally 🙂

you can choose from predefined colors as well as customize it fully with Cutom Color

Set data labels, configure it, and set category labels

Set Title of chart, Position of it, background color, forcolor, and Background of the chart itself with transparency of it.

Formatting is different for each visualization elements, so it is worthwhile to play with each chart and customize it to see what great options are available.
Color Saturation
This is great new feature added to bar chart that highlights some bars based on the field that you’ve mentioned in color saturation option.
chart below shows top goal scorer teams in FIFA 2014 worldcup and it is color saturated to highlight teams that scored more penalty goals!

you can also set visualization configuration for saturation

Insert Textbox, Hyperlinks, and Pictures
It was a lack of functionality I believe in the preview version, which I wish to change, and at last with great efforts of Microsoft team, now we can insert textboxes and pictures in the report.
Insert Image

Set Hyperlink and Insert Textbox

support for hyperlink is supported even in the data values.
Undo/Redo in Reports
Wow, It is always great to have these two wonderful options, Microsoft please keep these two everywhere.

Explore SQL Server Analysis Service Tabular Model with Live Connection
This is fabulous news, previously you could connect to SSAS, but the connection was not live connection. Now you are able to connect SSAS Tabular (Multi-Dimensional is not supported yet, it will be available in next updates) through a live connection.

For me this is the greatest feature of this release, Live connection to SSAS Tabular without requirement to load data through Power Query and set relationships was most wanted feature. I look forward to see this feature be available for SSAS Multi-Dimensional soon. As you see in screenshot below the connection window connects directly to the model in SSAS Tabular.

Finally the live connection provides all objects for you to work with

Relationship Diagram! Another most wanted functionality
This is another superb functionality added into this version. you can now see, configure and define relationships in the Relationship view from the left tabs easily.

You can edit relationships

Publish Directly into Power BI website from Power BI Desktop
Previously you could save your Power BI Designer files as *.pbix, and then upload them into Power BI website through the website itself. Now you can directly publish your work from Power BI Desktop into Power BI website.

Report published in the Power BI website
You can then schedule refresh of the data source file from Power BI website easily

Ability to set UPN for the Exchange Server Connection

That was all great features in this version of Power BI. You can watch Microsoft Power BI team features video to get familiar with all features mentioned above here:
Special Discount for Power BI Training Courses
Because of Power BI General Availability we’ve put special discount for our In-Person and Online Power BI 4 day courses, read more about it here:


Reza is author of more than 14 books on Microsoft Business Intelligence, most of these books are published under Power BI category. Among these are books such as Power BI DAX Simplified, Pro Power BI Architecture, Power BI from Rookie to Rock Star, Power Query books series, Row-Level Security in Power BI and etc.
He is an International Speaker in Microsoft Ignite, Microsoft Business Applications Summit, Data Insight Summit, PASS Summit, SQL Saturday and SQL user groups. And He is a Microsoft Certified Trainer.
Reza’s passion is to help you find the best data solution, he is Data enthusiast.
His articles on different aspects of technologies, especially on MS BI, can be found on his blog: https://radacad.com/blog.
8 thoughts on “All in One: What’s New in Power BI Desktop 2.0 GA”