

If you’ve ever tried printing a Power BI report and ended up with a mess of misaligned visuals, chopped-off tables, or missing headers, you’re not alone—and you’re definitely in the right place. Paginated Reports are the solution for anyone who needs pixel-perfect, multi-page, print-ready reporting in Power BI. Whether you’re building invoices, regulatory documents, or detailed financial statements, this guide will walk you through the 3 ways to create Power BI Paginated Reports, from the simplest web-based approach to full-blown enterprise-grade development. Let’s dive in and make your reports as polished as your insights.
Video
🧠 What Are Paginated Reports?
Before we dive into the methods, let’s quickly define what we mean by paginated reports.
Paginated Reports are designed for scenarios where you need:
- Multi-page layouts
- Headers and footers
- Precise control over print formatting
- Export to PDF, Word, or Excel
- Tables or matrices that span multiple pages
They’re built using RDL (Report Definition Language) files and are part of the broader Microsoft reporting ecosystem, including SQL Server Reporting Services (SSRS).
🚀 Method 1: Creating Paginated Reports in Power BI Service
Let’s start with the easiest and most accessible method.

✅ Who is it for?
- Beginners
- Business users
- Anyone who wants a quick, no-install solution
🛠 How it works:
- Go to your Power BI workspace in the Power BI Service or Microsoft Fabric portal.
- Click New > Paginated Report.
- Choose your Power BI semantic model as the data source.
- Use the web-based editor to build your report.

You’ll mostly work with table or matrix visuals. Add fields from your semantic model, configure headers and footers, and preview your report in real-time.
Want to add a page number? Easy. Insert a footer and drop in the page number element. Logos, text boxes, and basic formatting are all supported.
📁 File Format:
Once done, you can save or download your report as an .RDL file—distinct from the usual .PBIX files used in Power BI Desktop.
🎯 Pros:
- No installation required
- Works on any device (Mac, Windows, ARM)
- Great for quick reports
⚠️ Cons:
- Limited visual options (mostly tables/matrices)
- No advanced expressions or subreports
This is a fantastic starting point. If you’re just dipping your toes into paginated reporting, this method is your best friend.
🧰 Method 2: Using Power BI Report Builder
Now let’s level up.

✅ Who is it for?
- Intermediate users
- Analysts who want more control
- Users comfortable installing software
🛠 How it works:
- Download and install Power BI Report Builder.
- Launch the tool and connect to your Power BI semantic model.
- Use the Query Designer to select fields and measures.
- Build your report using the Table or Matrix Wizard, or manually add visuals.

Report Builder is a descendant of the classic SSRS Report Builder, and it’s packed with features:
- Charts
- Maps
- Sparklines
- Advanced expressions
- Page layout customization (A4, Letter, Landscape, Portrait)
You can configure margins, page sizes, and even embed expressions for dynamic content. It’s a richer experience than the web editor, and you’ll feel the difference immediately.
📁 File Format:
Again, you’ll be working with .RDL files, which you can publish directly to the Power BI Service or upload manually.
🎯 Pros:
- More visual options
- Advanced layout control
- Expression support
⚠️ Cons:
- Requires installation
- Slight learning curve
- Not as intuitive as Power BI Desktop
If you’re serious about paginated reporting but not quite ready to dive into developer tools, this is your sweet spot.
👨💻 Method 3: Building Paginated Reports in Visual Studio
Ready to go pro? Let’s talk about the most powerful method.

✅ Who is it for?
- Developers
- Technical consultants
- Power users building complex reporting solutions
🛠 How it works:
- Install Visual Studio (Community Edition is free).
- Add the Reporting Services Projects extension.
- Create a new Reporting Services Project.
- Add multiple .RDL files, data sources, and datasets.
- Use the full suite of SSRS tools to build your report.
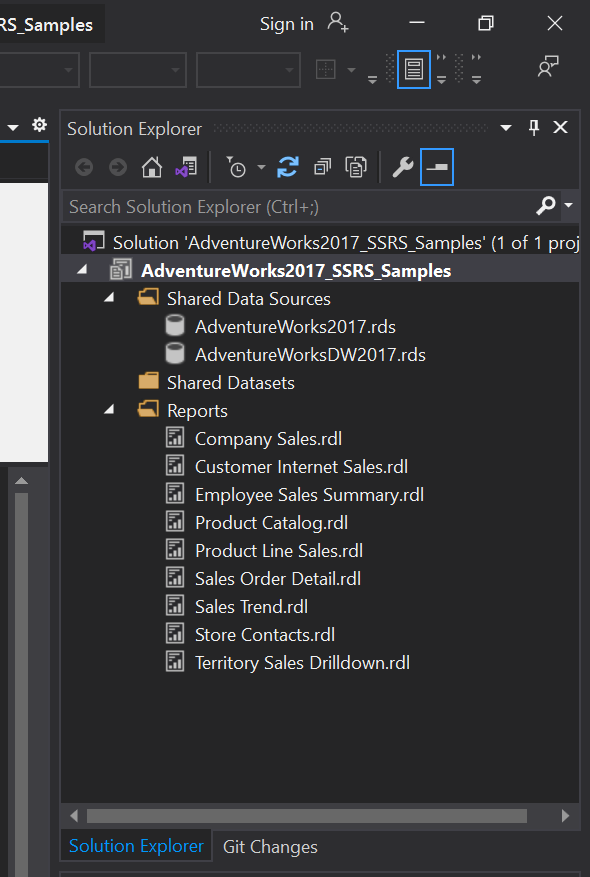
Visual Studio gives you unparalleled control:
- Multiple data sources
- Subreports and navigation
- Complex expressions
- Full property management
- Project-style organization
You can build enterprise-grade reports with deep customization. Every field, every visual, every property can be fine-tuned. It’s not for the faint of heart, but it’s the gold standard for serious reporting.
📁 File Format:
You’ll still be working with .RDL files, which can be published to Power BI or SSRS environments.
🎯 Pros:
- Full control over every aspect
- Ideal for enterprise reporting
- Supports advanced scenarios
⚠️ Cons:
- Steep learning curve
- Requires Visual Studio and extensions
- Not suitable for casual users
If you’re building reports for a large organization or need advanced features like subreports and navigation, this is the way to go.
🧾 Bonus Tip: Consider “Analyze in Excel”
Before you commit to paginated reports, ask yourself: Do I really need them?
Sometimes, the Analyze in Excel feature in Power BI is enough. It lets you connect Excel directly to your Power BI semantic model and build pixel-perfect reports using Excel’s familiar interface.
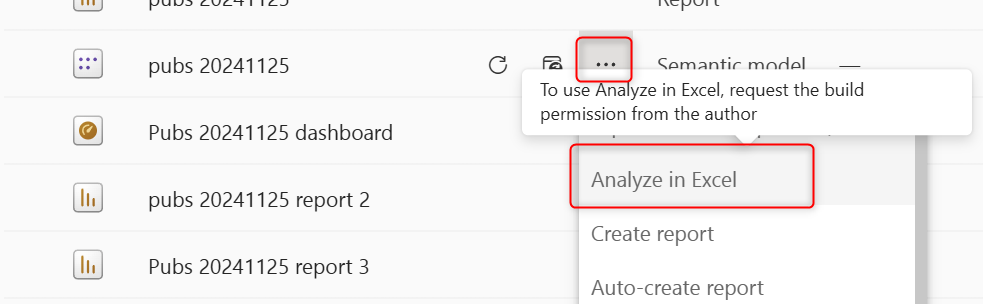
You get:
- Live connection to Power BI
- Excel’s print layout tools
- Easy export to PDF or Word
It’s not as powerful as paginated reports, but for many users, it’s more than enough.
🧑🏫 Final Thoughts
To recap, here are the 3 ways to create Power BI Paginated Reports:
| Method | Tool | Skill Level | Visuals | Expressions | Subreports | Export Formats |
|---|---|---|---|---|---|---|
| Power BI Service | Web Editor | Beginner | Basic | No | No | PDF, Word, Excel |
| Report Builder | Desktop App | Intermediate | Rich | Yes | Limited | PDF, Word, Excel |
| Visual Studio | Developer IDE | Advanced | Full | Advanced | Yes | All formats |
Paginated Reports are a hidden gem in the Power BI ecosystem. Whether you’re printing invoices, building financial statements, or designing multi-page dashboards, they give you the precision and control that interactive reports can’t.
Start simple, grow your skills, and explore the full spectrum of tools available. And remember—if you ever feel stuck, Radacad has your back with tutorials, videos, and expert guidance.


Reza is author of more than 14 books on Microsoft Business Intelligence, most of these books are published under Power BI category. Among these are books such as Power BI DAX Simplified, Pro Power BI Architecture, Power BI from Rookie to Rock Star, Power Query books series, Row-Level Security in Power BI and etc.
He is an International Speaker in Microsoft Ignite, Microsoft Business Applications Summit, Data Insight Summit, PASS Summit, SQL Saturday and SQL user groups. And He is a Microsoft Certified Trainer.
Reza’s passion is to help you find the best data solution, he is Data enthusiast.
His articles on different aspects of technologies, especially on MS BI, can be found on his blog: https://radacad.com/blog.