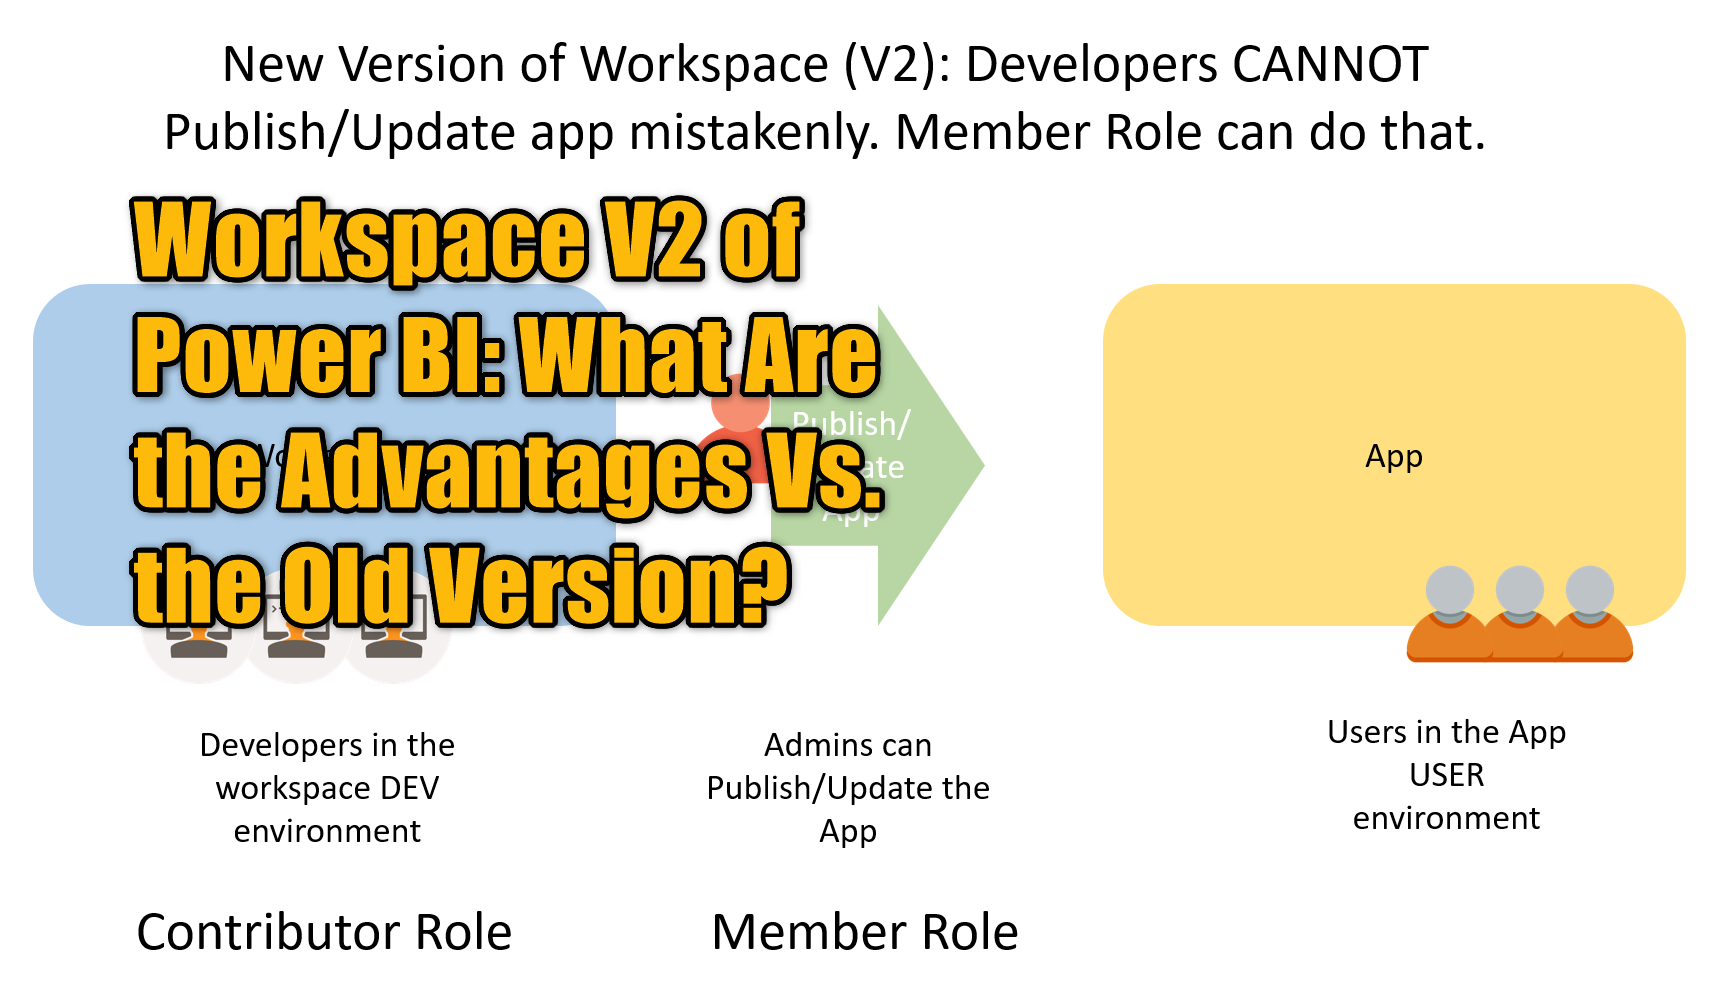
Dynamic Row Level Security with Organizational Hierarchy Power BI

In previous posts, I covered some methods of Dynamic Row Level Security including Row Level Security user based, With Manager Level Access, and also with User and Profiles as a many to many relationships. In this post, I’m going to cover another common scenario for row level security; Organizational hierarchy for security. Through organizational hierarchy Read more about Dynamic Row Level Security with Organizational Hierarchy Power BI[…]

Dynamic Row Level Security with Profiles and Users in Power BI : Many-to-Many Relationship

The Dynamic RLS topic is getting a good response in my blog post, so I intend to write about other types of scenarios that a security would be required. In this post, we are going to look at another type of security which deals with users and their profiles. Sometimes you have a user part Read more about Dynamic Row Level Security with Profiles and Users in Power BI : Many-to-Many Relationship[…]

Dynamic Row Level Security with Manager Level Access in Power BI

I have written while ago, about how to implement a dynamic row level security in Power BI. This post is an addition to that post. I’ve had a lot of inquiries that; “What If I want users to see their own data, and the Manager to see everything?”, or “How to add Manager or Director Read more about Dynamic Row Level Security with Manager Level Access in Power BI[…]

Integrate Power BI Into Your Application: Part 6 – Real-time Streaming and Push Data

It’s been a while since the last post about Power BI REST API. I have written previously about how to get the REST API, and use it in your application, how the authentication works, and things such as embedding content, and data source management. In this post, I’m going to explain one of the functionalities Read more about Integrate Power BI Into Your Application: Part 6 – Real-time Streaming and Push Data[…]

New Power BI and Analytics Features in PASS Summit 2017 Keynote – Live (Hit Refresh)

PASS Summit 2017 Keynote in live now. Leila and I are sitting in bloggers table here, and will blog from here all new announcement through this post. Please Hit Refresh! Here we are at blogger’s table: Azure SQL Database and Machine Learning on a massive data set, demoed; Super fast loading 1.4 millions of records Read more about New Power BI and Analytics Features in PASS Summit 2017 Keynote – Live (Hit Refresh)[…]

Measure vs Calculated Column: The Mysterious Question? Not!

Despite all articles, blog posts, and videos on the topic of DAX Measures and Calculated columns, I still hear here and there that people ask what is the difference between Measure and Calculated Column? What situation should we use each of these? and on the other hand, what is the difference of creating column here, Read more about Measure vs Calculated Column: The Mysterious Question? Not![…]

Searching a Field or Table in Power BI Visualization: Power BI Helper

Last week, we announced the very first version of Power BI Helper. Power BI Helper is a tool that helps clean up a Power BI solution. This week we have an updated version with a new interesting feature: Searching for a Field or Table in all visualizations in the PBIX file. The additional feature is helpful for further Read more about Searching a Field or Table in Power BI Visualization: Power BI Helper[…]

Power BI Cleanup Tool; Time Saving with Power BI Helper

Power BI files can easily get big. You can have 50 tables in a Power BI model, and 25 reports. When Power BI file gets in that size, maintenance is always an issue. It will take lots of time to find out if all of those 50 tables actually used in reports and visualization or not. Read more about Power BI Cleanup Tool; Time Saving with Power BI Helper[…]

Download Slides of Presentations in Power BI World Tour San Francisco

Power BI World Tour in San Francisco ran on 4th and 5th of October in Bay Area (Microsoft Sunnyvale). As a speaker, it is always a great opportunity for me and Leila to speak in such events and meet new people in the community. In San Francisco world tour, Leila and I presented 4 topics Read more about Download Slides of Presentations in Power BI World Tour San Francisco[…]

Ribbon Chart is the Next Generation of Stacked Column Chart

Earlier this month (September 2017), in the new version of Power BI Desktop, a new type of chart announced; Ribbon Chart. The very first look and feel of this chart are similar to Stacked Column Chart. The question that might come into your mind is that; why another way of showing the same thing? The Read more about Ribbon Chart is the Next Generation of Stacked Column Chart[…]