
In the previous Post , I start to do prediction the cancer diagnosis using some laboratory data. I have explained some of the main components for doing the data cleaning such as “SQL Transformation”, “Edit Meta Data”, “Select Columns” and “Missing Values”.
In this post I am going to show the rest of data cleaning process using Azure ML components and how to split data for training.
In the last post, we come up with the below process.
Now we are going to do some more data cleaning as “Normalization of Data”.
look at the out put of the data from “Edit metadata”:
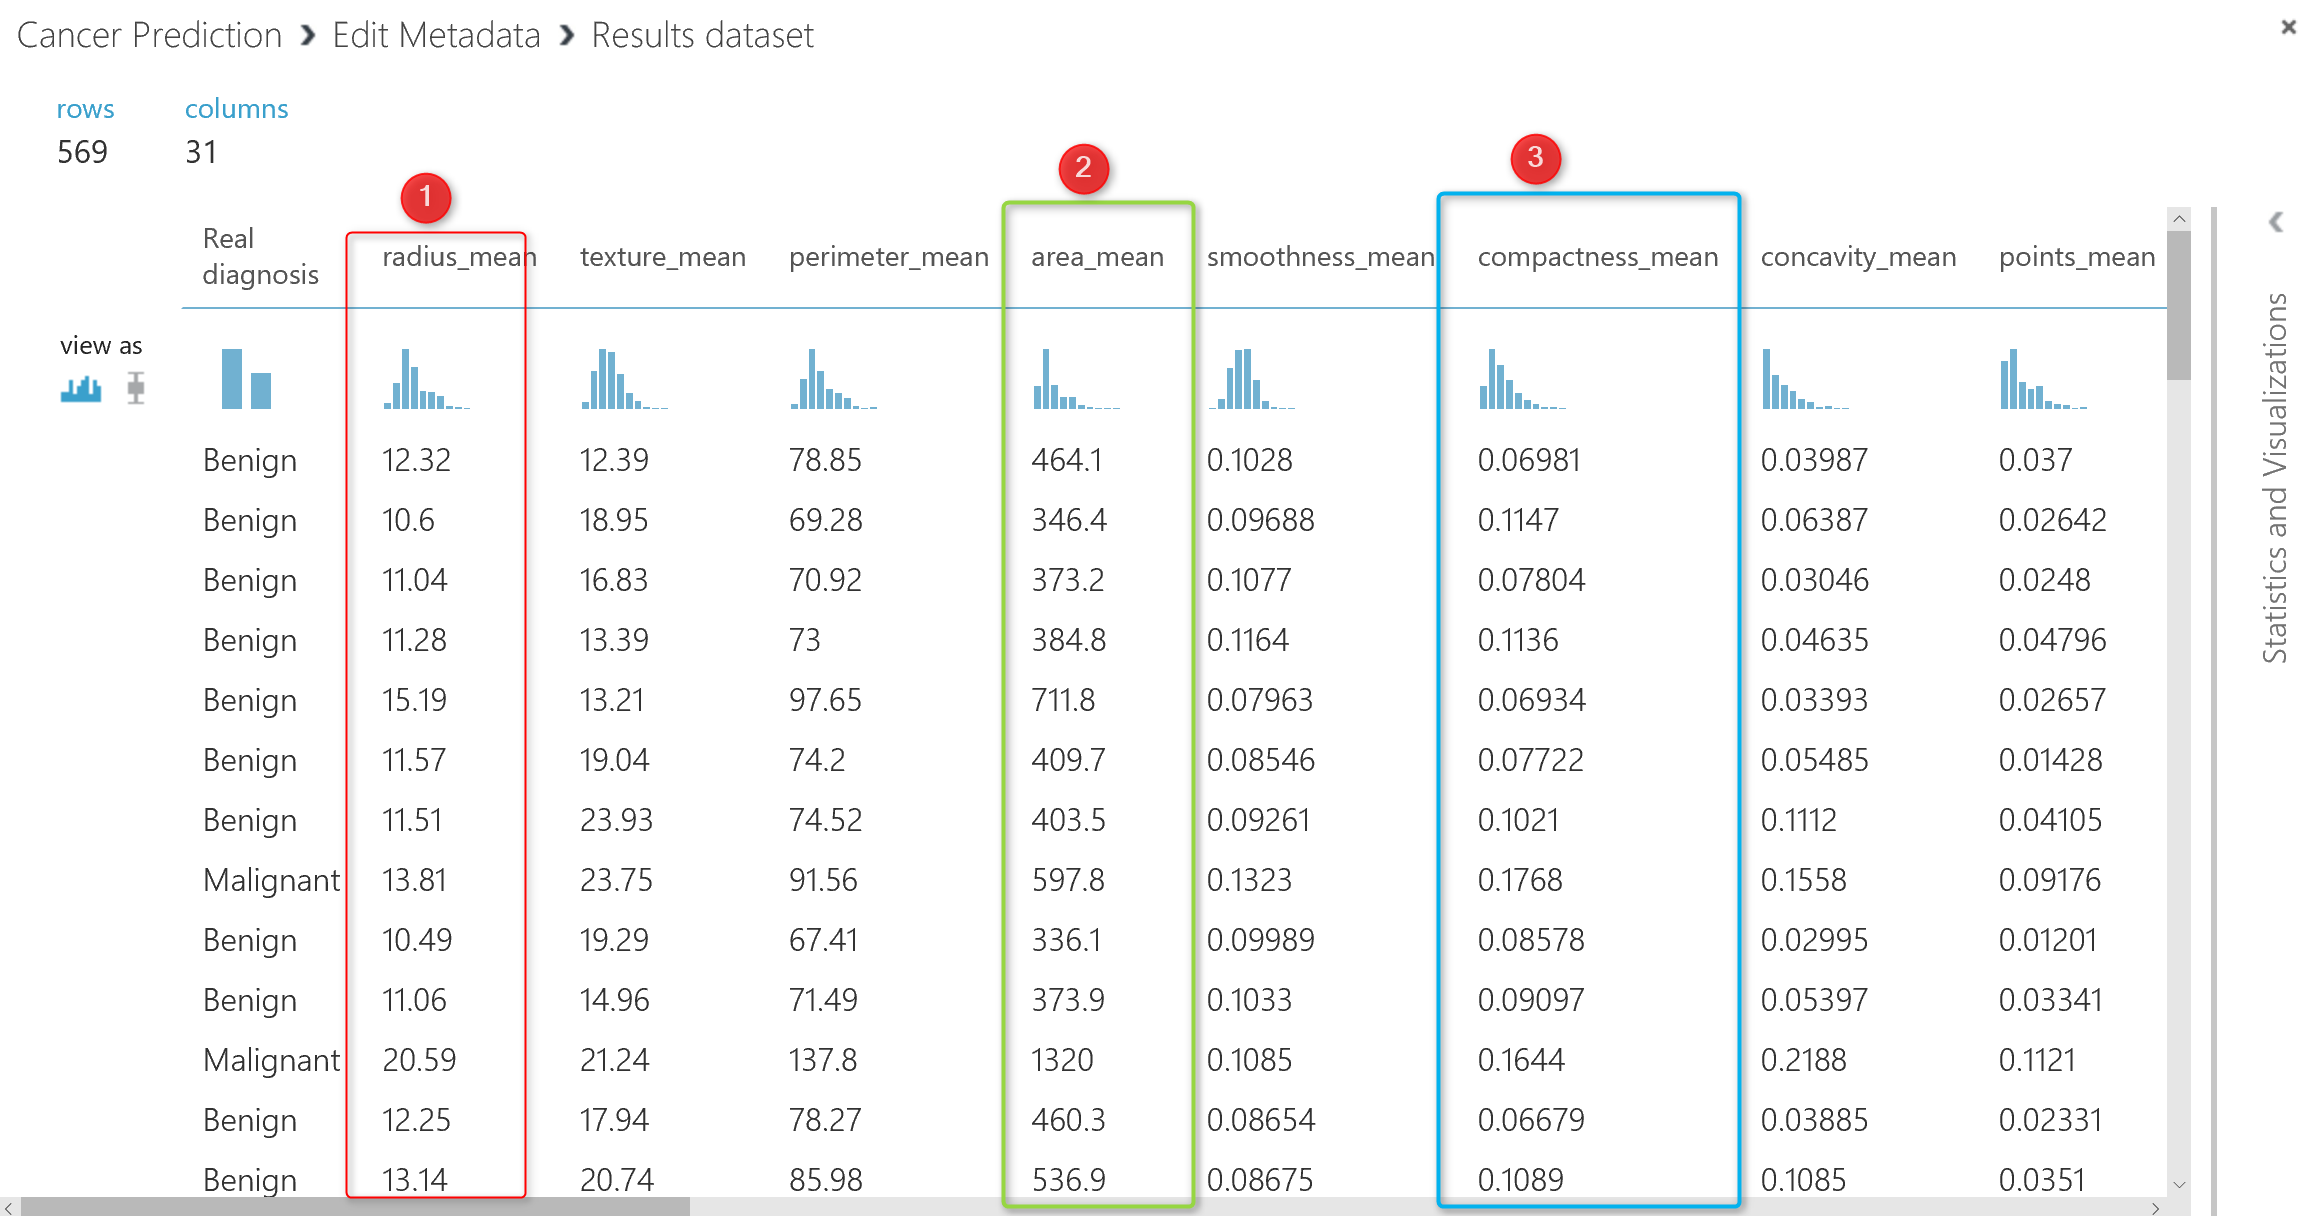
If you look at the data, you will see that each column has its own data range, for instance column 2 (number 1 in above picture ) has data range between 9 to 20, whilst the column number 5 (number 2 in picture) has values between 100 to 500, the same for the column 6 (number 3), the data range is between 0.01 to 0.1. So the data is not in the same range. To do the machine learning, it is important that all data be in the same range. I am going to bring data in range of 0 to 1 using “Min Max” algorithm. There is a component in Azure Ml name “Normalize Data“.
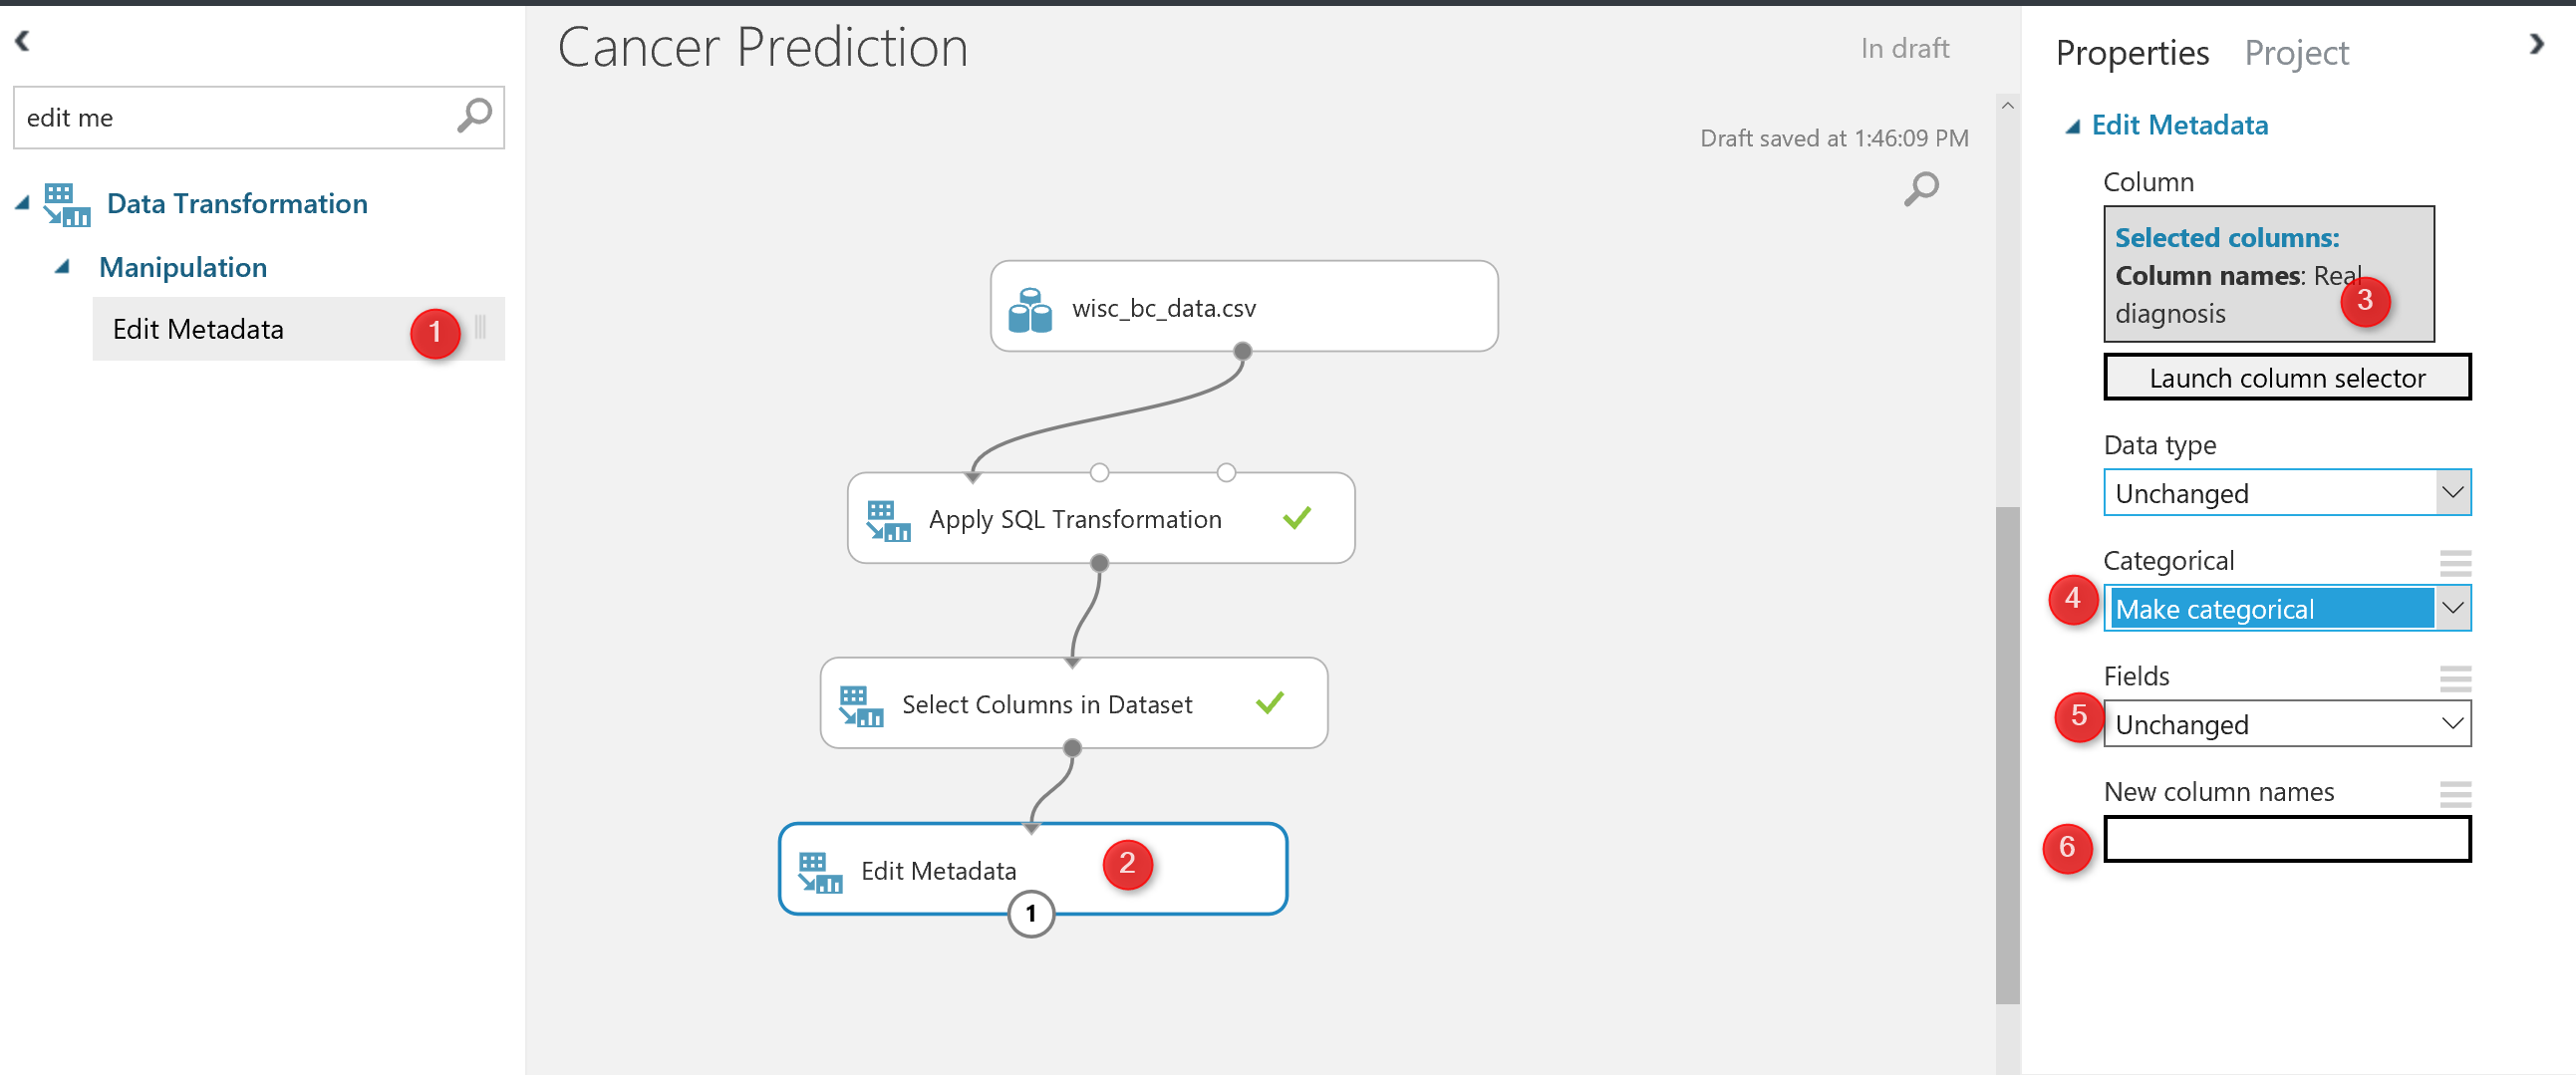
As you can see in the below picture, Normalize data component exits under “Data Transformation” Component.

I just drag and drop the component to the experiment area, in the right side of the experiment, we able to specify the normalization method (number 4 in above picture), for this experiment I have choose the “Min Max” method. Also, we able to select which column we want to normalize (number 5 in picture).
After running the experiment we will have below data set that is totally normalized in comparison with the previous one.

So, now we have enough data cleaning and data wrangling in our dataset. The next step is about the “Choosing the right data for prediction” that we call it ” Feature Selection”.
Feature selection
is the process of finding which attribute ha more impact on the prediction columns. In our example, we are going to see which laboratory measure has more impact on the Diagnosis result.
There are many approach in machine learning to do that using algorithms like “regression, decision tree”, correlation analysis will help.
in Azure Ml there is a component name “Filter Based Feature Selection”.
in the below picture, I have shown how I use it to find which attributes has more impact on the diagnosis of the cancer condition.
As you can see in the below picture, I have connected the output of the normalization component to the input node of the “Filter Based Feature Selection“. by clicking on this node, in the right side, you will see some options that you have to set them up first.
First of all, you should choose the algorithm for the aim of feature selection. In this experiment, I have choose the “Pearson Correlation” analysis (Number 3) . However, there are many other approaches that I will talk about them later. Then, in the next textbox (number 4), I have identified the columns that I want to predict, which in our example is “Diagnosis column“.
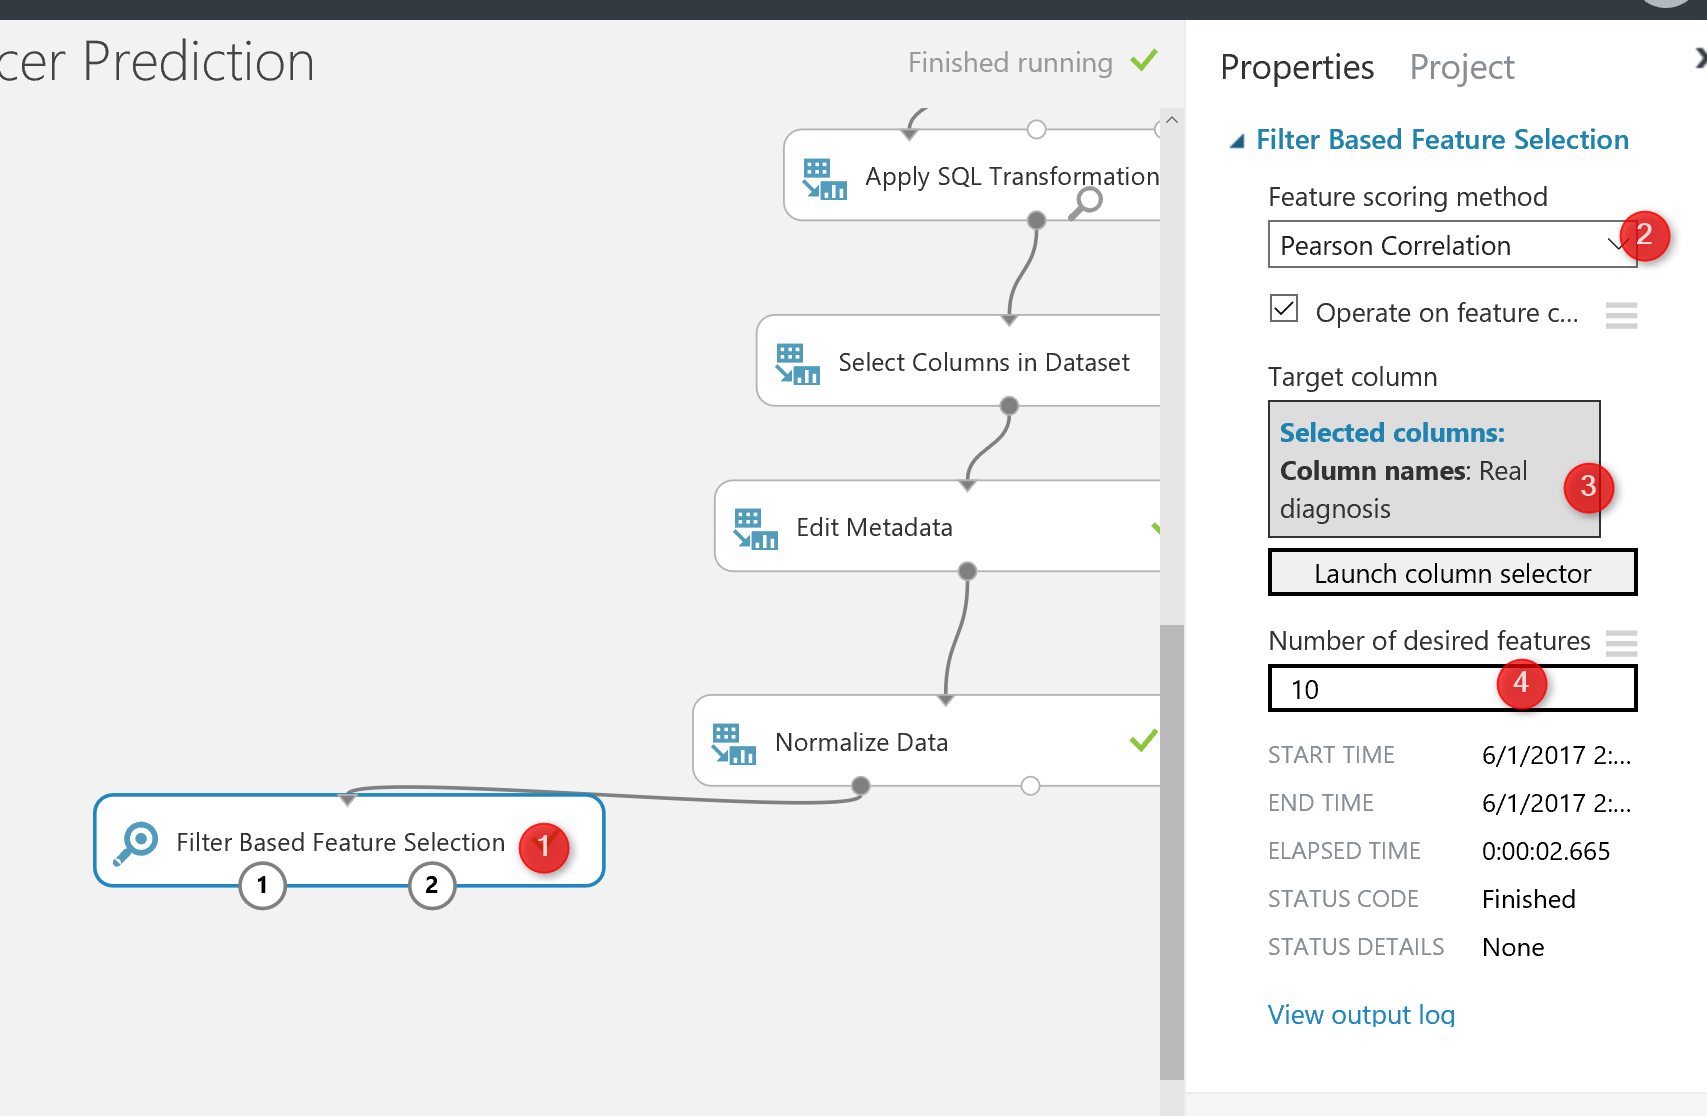
Finally, in the last textbox, I specify the number of features that I am interested to have for prediction among 32 columns, the default value is 1, but I specify it as 10 (see below picture).
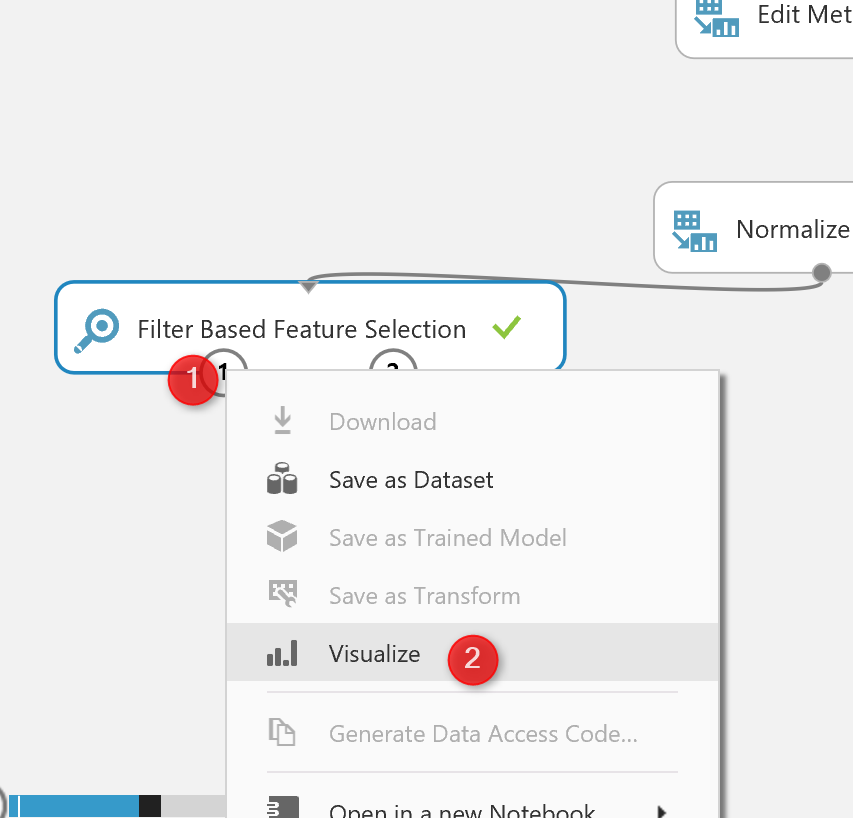
Then, I run the experiment to see the result of the feature selection by right click on the left output of the node (see number 1 in below picture)
The below result will be shown, as you can see, now we have 11 columns instead of the 32 that means these are columns that have more impact on the predicting of cancer diagnosis.

If you right click on the right side output node of the “feature selection” and visualize the dataset, you will see below data:
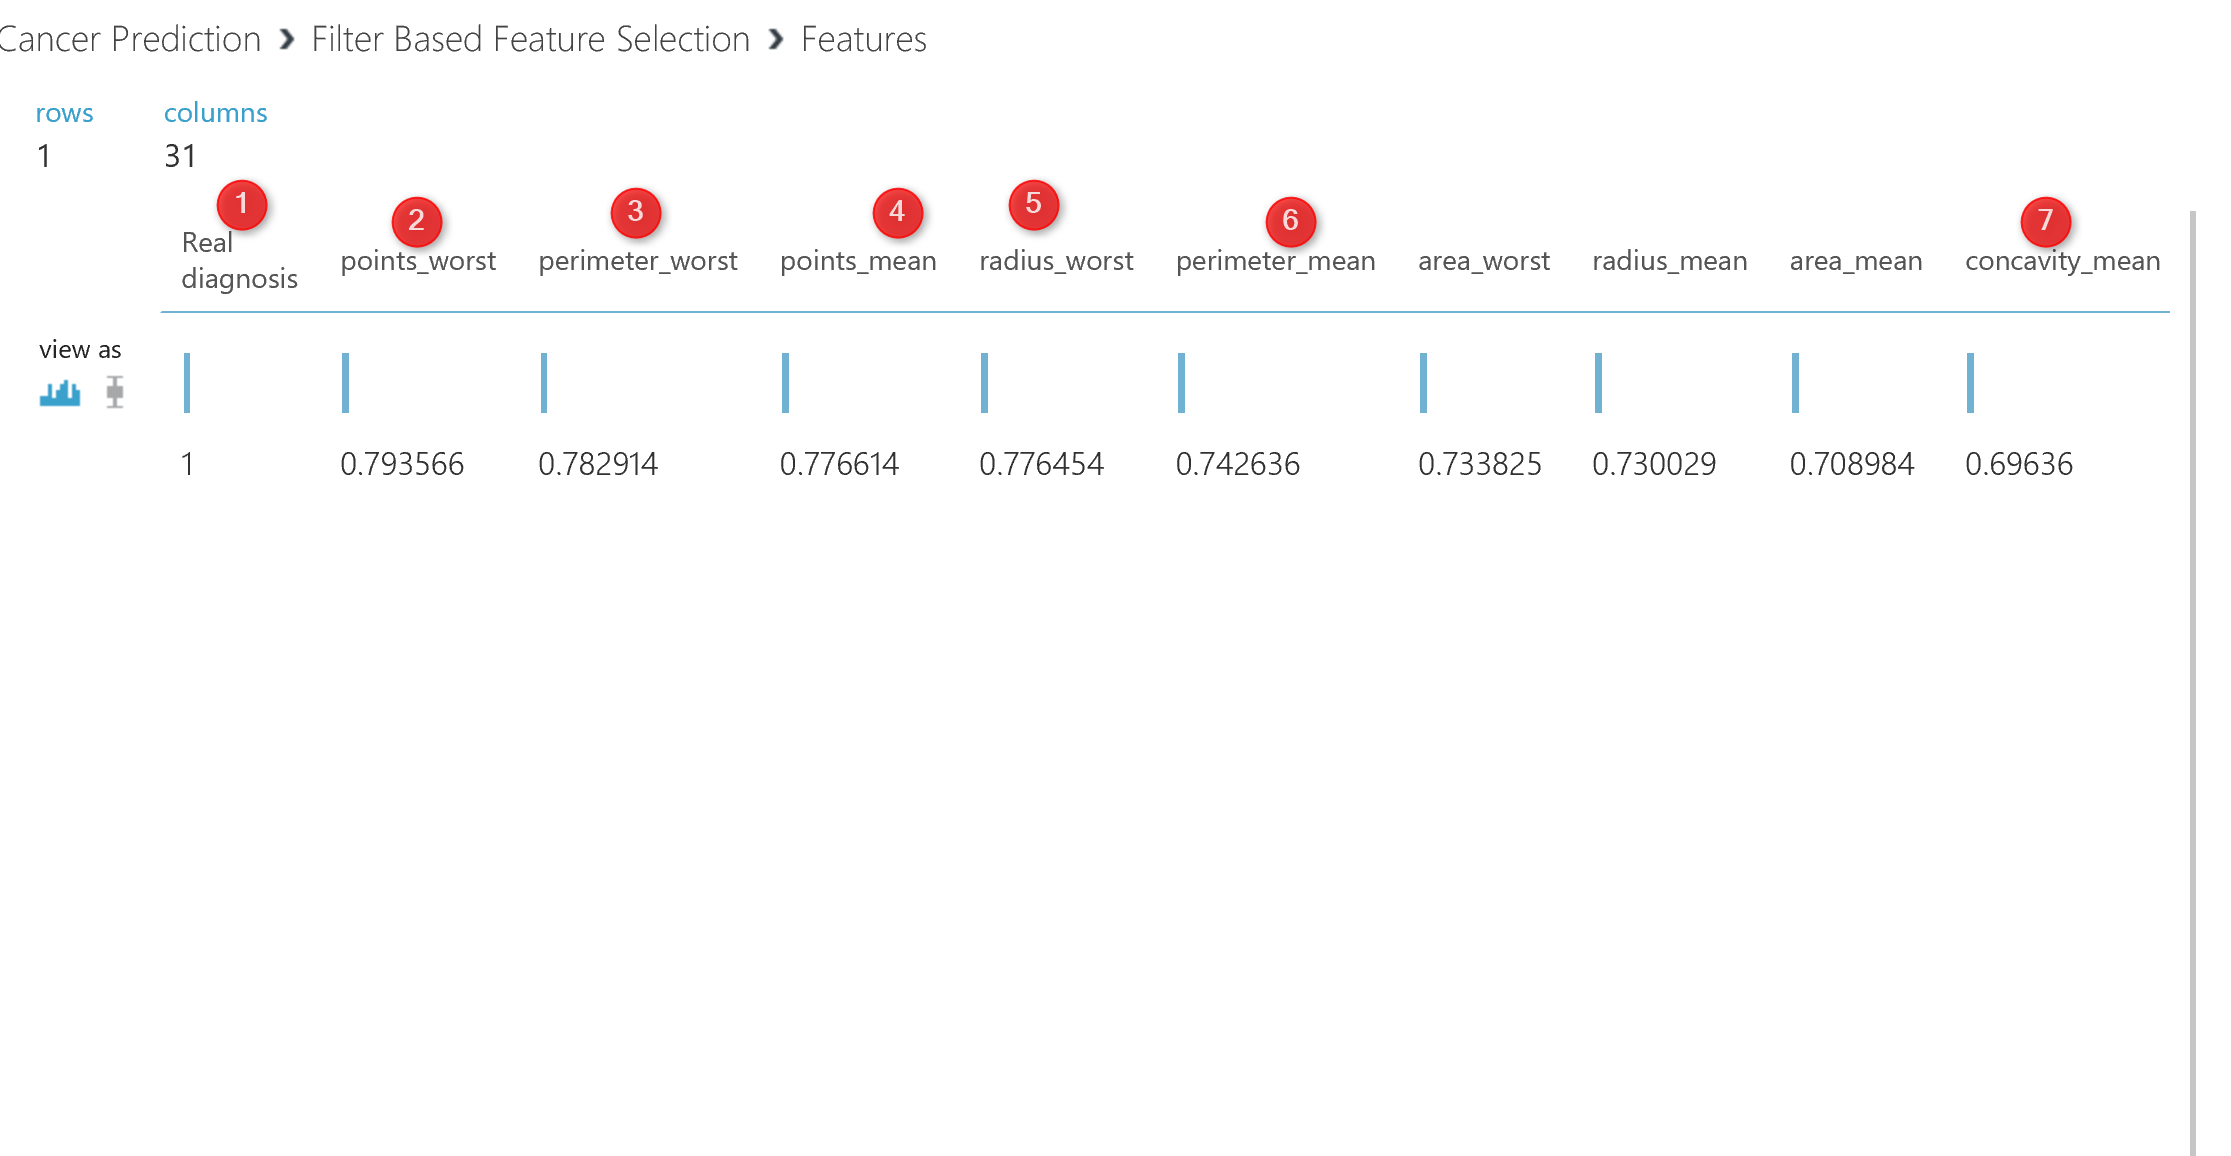
This data shows which factor has impact more on the “real diagnosis” column, for instance, column “Point_Worst” has 79% impact on the diagnosis, or “Perimeter_worst” has 78% impact. all of these analysis has been done by correlation analysis to see the impact of each attributes on predictable column.
We done by data cleaning and feature selection. Now we clean our data, we identify which factor has more impact on the “caner Diagnosis”.
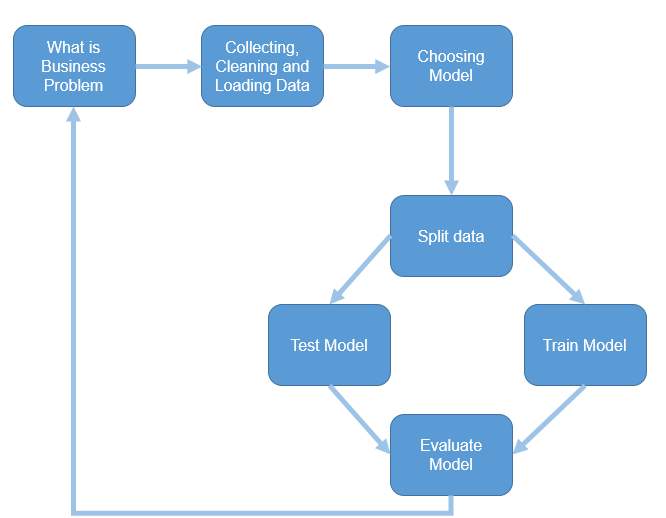
The next step according the machine learning process is so spit data for training and testing purpose
Split Data
The main aim of the machine learning is to learn from past data, so we have to provide a set of data to train the model. The training dataset, helps an algorithm to better understand the data behaviour, so able to learn from past data and predict the future data.
Also, after creating the model, we should test it to see whether they predict well or not, so we have to provide a Test dataset from what we already have to check the results.
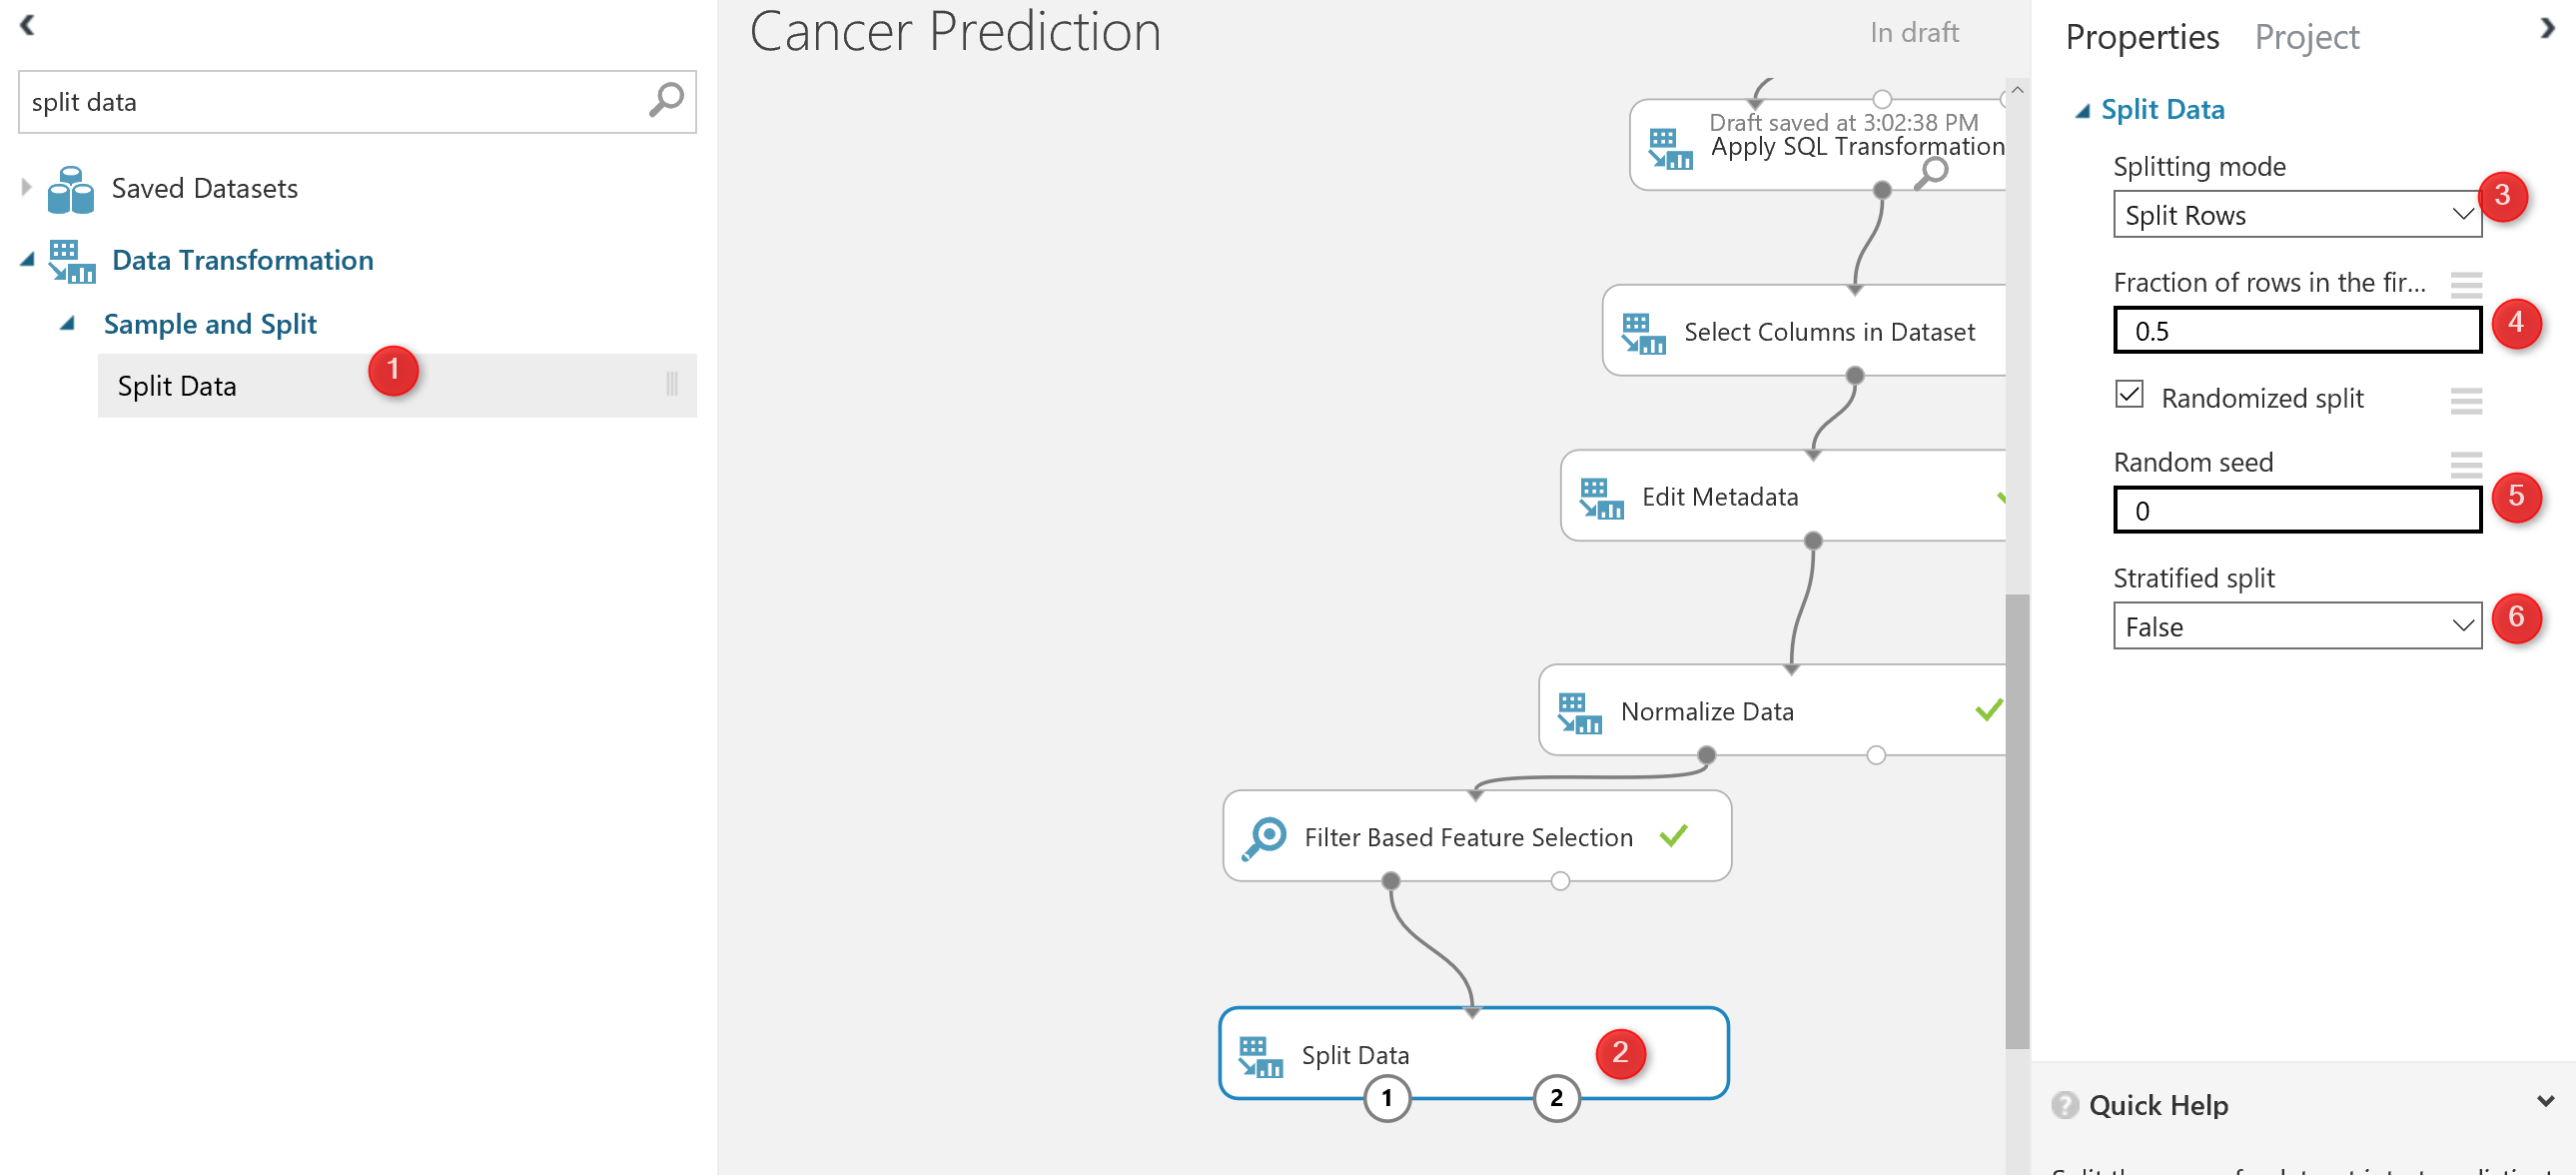
there is a component in Azure ml that help us to create a test and train dataset name “Split Data“. split data can be found under the “Data Transformation” component. (number 1). Just drag and drop it to the experiment and connect it to the output of “feature selection” ( the dataset output that is in left side).
Then in the right side of the experiment, you will see a windows that show the parameter list. the first parameter identifies how to split the dataset, which I choose the “Split Rows” , there are other approach like using regular expression for dividing the dataset into train and test, which hopefully I will talk about them later. Next in the number 4, you see that I specify that 0.5 % of data should go for testing and 0.5% for training. always this percentage should be above 70% that provides more data for training. in number 5 and 6 we can set a value for seed to make the experiment consistence for each run.
Now by running the code , we have two datasets: Training dataset which located in the left side of the “Split Data”. The test data has been located in the right side of the “split Node”
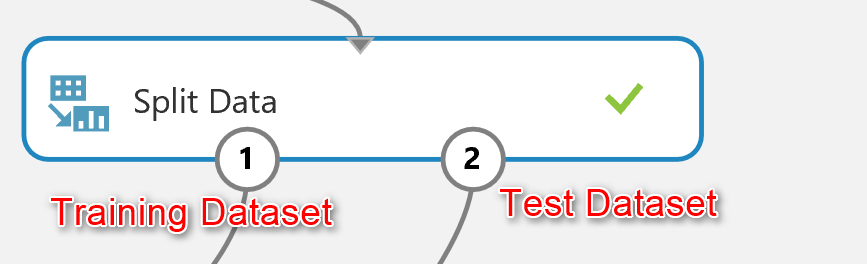
Now we have “Training dataset” and “Testing Dataset”.
In the next post I will show how to choose algorithms and also how to train, test, and evaluate the model.


