

Before machine learning, we need to go through two main processes: Data preparation and Data wrangling. Data preparation is about the collecting data from resources, integrate and load data in one resource, that is so like ETL (extract, transform, and load process) [2].
According to [2], Data wrangling is when we loaded the data and applying the data cleaning, formatting, and integration in the application layer.
In python language, there is some popular data wrangling process such as:
Reshaping data
One of the main approaches for reshaping data is pivoting, that is about converting a column data to the column name. As you can see in figure 6-5 [3].
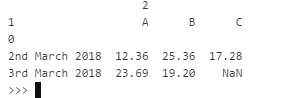
The related code in Python is:
data=[["2nd March 2018","A",12.36],   ["3rd March 2018","A",23.69],  ["2nd March 2018","B",25.36],     ["2nd March 2018","C",17.28],    ["3rd March 2018","B",19.2]]
using package pandas
import pandas as pd
df=pd.DataFrame(data)
 pivot table
df=pd.pivot_table(df,index=[df[0]],columns=df[1])
Also in R, we can do this via below codes
install.packages("tidyr")
date=c("2nd March 2018","2nd March 2018","2nd March 2018","2nd March 2018","2nd March 2018")
Type=c("A","A","B","C","B")
index=c(0,1,2,3,4)
Value=c(12.36,23.69,25.36,17.28,19.2)
df=data.frame(index,date,Type,Value)
library("tidyr")
spread(df,Type,Value)
and the result is the same (a bit different out put)
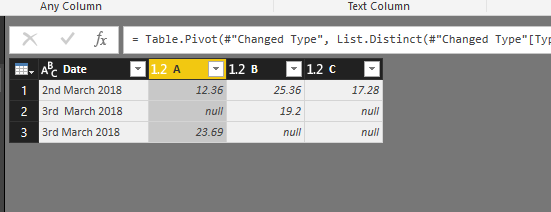
Now let’s see how we can be done this process in Power Query without writing any code. To pivot data using Power Query, we need to enter data using “Enter Data Manually” option.
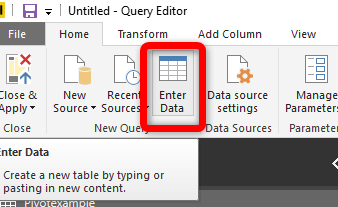
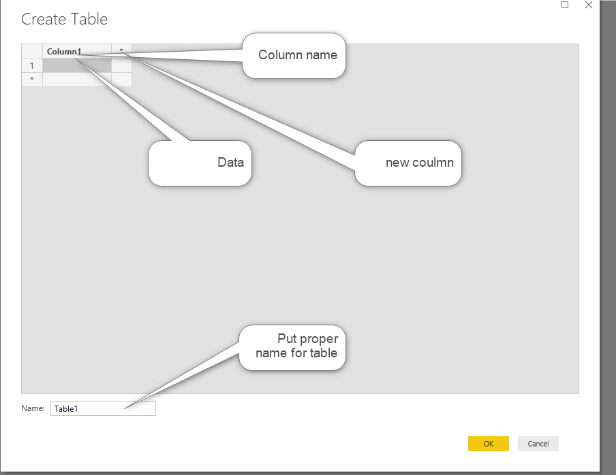
By clicking on the “Enter Data”, you able to put data manually in Power Query.
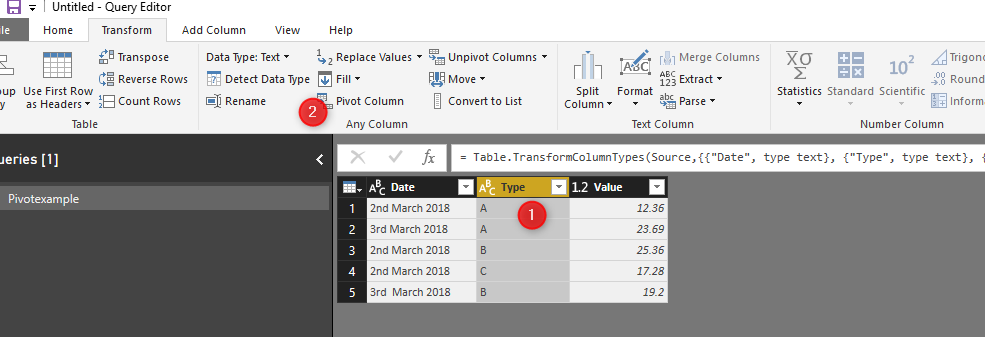
We have the same data as we have in Python. Then we need to just click on the type column, Then click on the “Pivot Colum” in Transformation tab. The result of pivoting is shown in below picture.
Then you need to specify which column you are going to put a value and type.


Merging DataSet
Another data preparation that is so popular is about merging the data. In Python, if we want to do that, there is a function named “merge”, that we can use it to connect two different datasets. For instance, we have a dataset as below:
data1=[["a",11],["b",1],["c",99]]
data2=[["a",20],["b",0],["d",21]]
data1=pd.DataFrame(data1)
data1.columns=["Type","Value"]
data2.columns=["Type","Value"]
data2=pd.DataFrame(data2)
merg=pd.merge(data1,data2,how='left',on="Type")
As you can see in above code we able to specify the join type and join column. We can change "how“ attribute to “left”, “right”,”inner”, and “outer”.

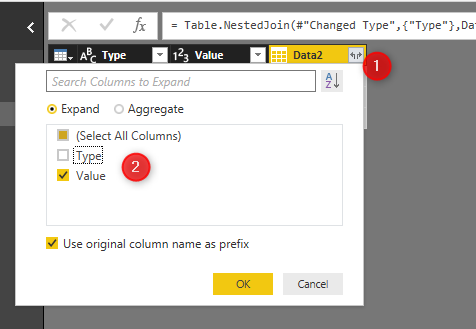
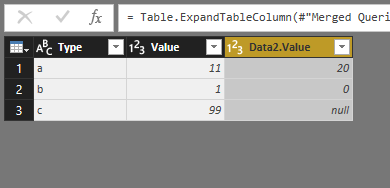
The same process can be done in Power Query. I have created two different datasets “Data1” and “Data2”. After creating a dataset, you need to click on the “Merge” column to merge “Data1” with “Data2” .
In merge window, we able to specify which column we are going to merge based on and what type of merge we are interested. After merging, you need to specify what columns you want to show to users. Please follow steps explained in Figure 6-19. Then the output will be there and you able to see the results.


These are some basic data transformation that you can do in Power Query. There is some more complex process that you can do using Power Query menu or M or R languages.
[2] https://blogs.sas.com/content/datamanagement/2016/09/06/data-prep-and-data-wrangling1/
[3] https://s3.amazonaws.com/assets.datacamp.com/blog_assets/Python_Pandas_Cheat_Sheet_2.pdf
[4] https://www.kaggle.com/uciml/breast-cancer-wisconsin-data/downloads/data.csv
[5] http://radacad.com/online-book-power-bi-from-rookie-to-rockstar


Dear Leila,
“There are no goodbyes for us. Wherever you are, you will be in our hearts.”
~Mahatma Gandhi