

Microsoft Data insight Summit 2017 has been held in Seattle from 12 to 13 Jun. It is the main conference for Microsoft Data Analysis with Power BI. All interesting and new topics in Power BI has been presented.
Most of the speakers are from Microsoft product team or experienced speakers in this fields.
there are about 2000 people has been attended. in this conference.
I was honoured to be speak in two different topics in this conference.
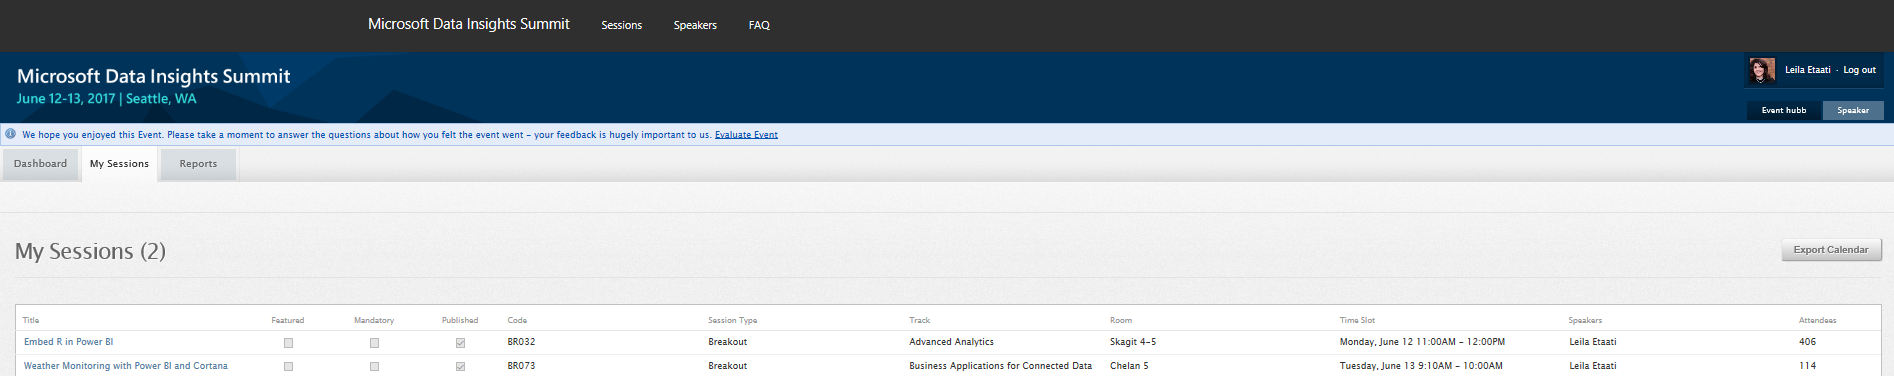
here are my sessions:
1- Embedded R in Power BI (406 attendees were interested in this session)
Everyone is talking about machine learning and R recently. R is a language for data analysis and machine learning that’s becoming increasingly important. Microsoft introduces R server as a comprehensive platform for using machine learning and R functionality inside data analysis tools such as Power BI. In this session audience will learn how to do data wrangling, apply Machine learning algorithms on available dataset, and shows R visuals in Power BI.
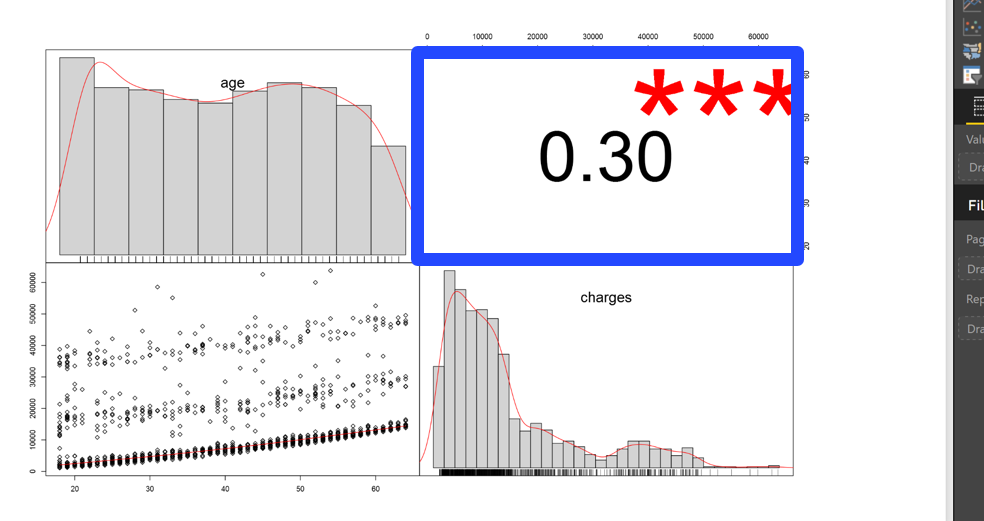
I show how to draw a “Correlation Diagram” in Power BI using R codes
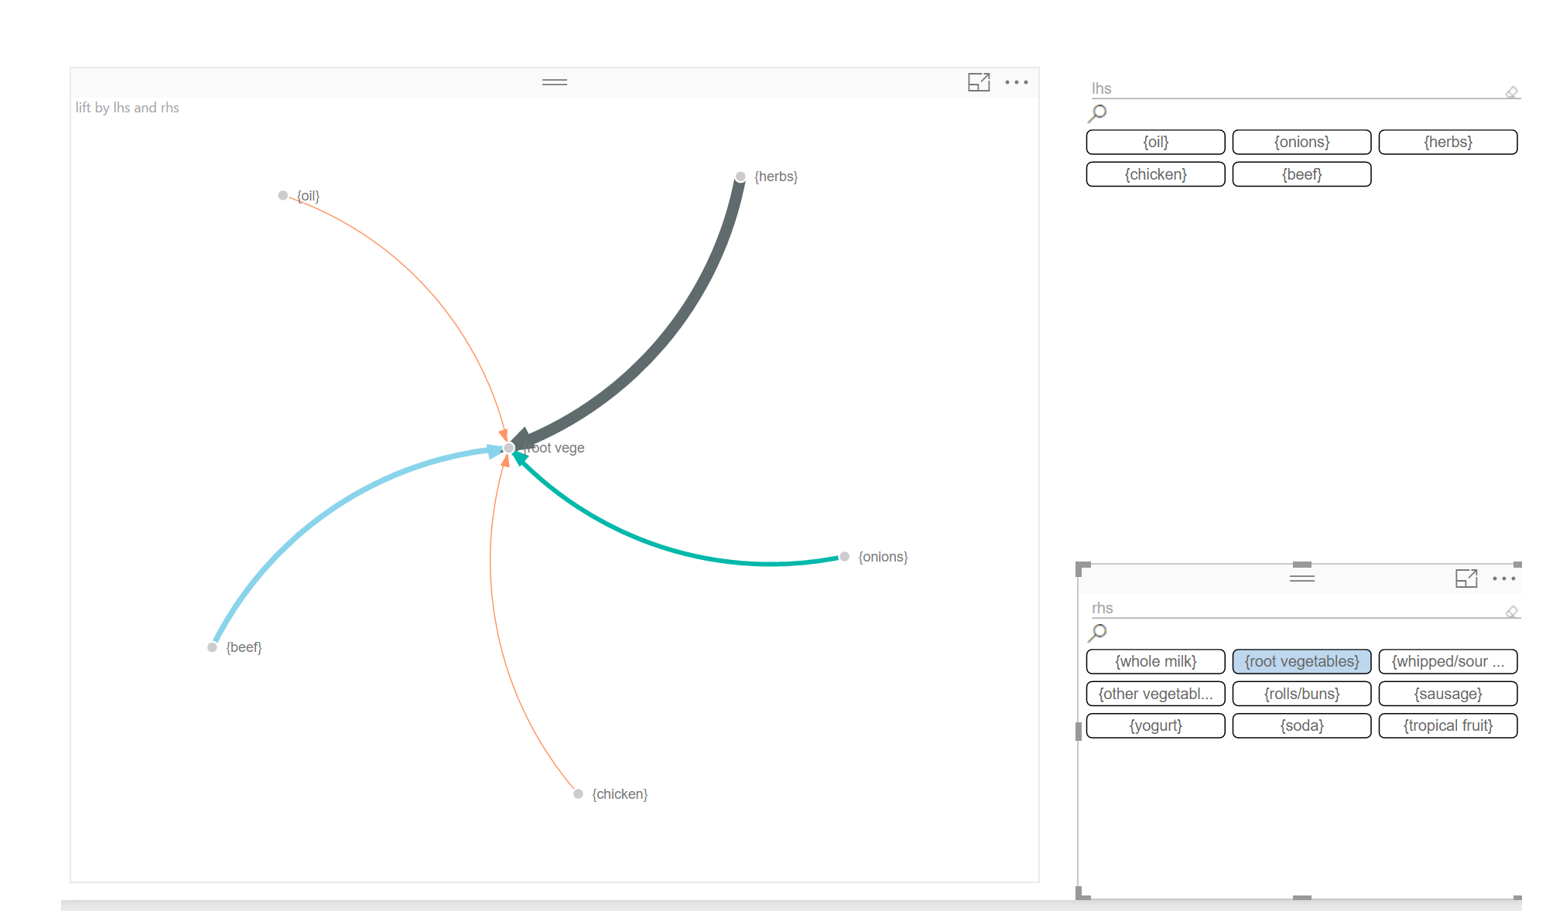
Also I have shown how to do the Market Basket Analysis inside power BI with Power Query and using the power bi visualization to better comprehend the results.
see the file from here
Power BI files
Power BI for Advance Analytics in Data insight Summit (19942 downloads )
Also you able to watch the video from here
2.Weather Monitoring with Power BI and Cortana (114 attendees were interested in session)
This session will show how Power BI and Cortana are used for monitoring live data collected from devices like weather sensors. In this demo, you will learn how to set up an IoT device like the Raspberry Pi how to use different components of Cortana Intelligence suite for transferring data (Azure service bus and azure stream analytics), how to derive insights from collected data using azure ML, and finally how to demonstrate the results through Power BI automatically. In power BI, the result of Azure ML analysis and live data will be shown. After this session, you will learn how to get live data from physical devices and then show it live in Power BI visualization.
I have shown how to data live streaming using Cortana and power BI. I have shown all the process and briefly steps for doing it. you see the video from here:


