
A question I’ve come across recently is around ways to better organise measures in Power BI so they are easier to find.
The query is usually along the lines of wishing there was a way to group measures together in the field list so users don’t have to scroll and search. Measures can often be spread across multiple tables and become harder to find as more tables are added to the data model.
I’m going to share in this blog a technique I’ve found useful in Power BI for collecting measures together in once place AND placing them at the top of the field list.
The good news is, calculated measures do not have to exist on the table that stores the underlying data specific to that measure. Measures can be placed on any table in the model and they will still work as expected. This may not be immediately obvious but it’s handy to know.
So lets look at the following simple calculated measure which counts the rows in the Customers table.
Count of Customers = COUNTROWS('Customers')While it might make sense to create this measure on a Customer table, there is nothing stopping you creating the measure on any other table in the data model. It will still yield the same result. So in theory, you could create this particular measure on a Date table and the measure will still work as expected.
I’m not suggesting you create measures on your Date table but we can create a dummy table specifically to house your measures meaning they will be grouped together and easier to find.
This can be done easily enough as follows :
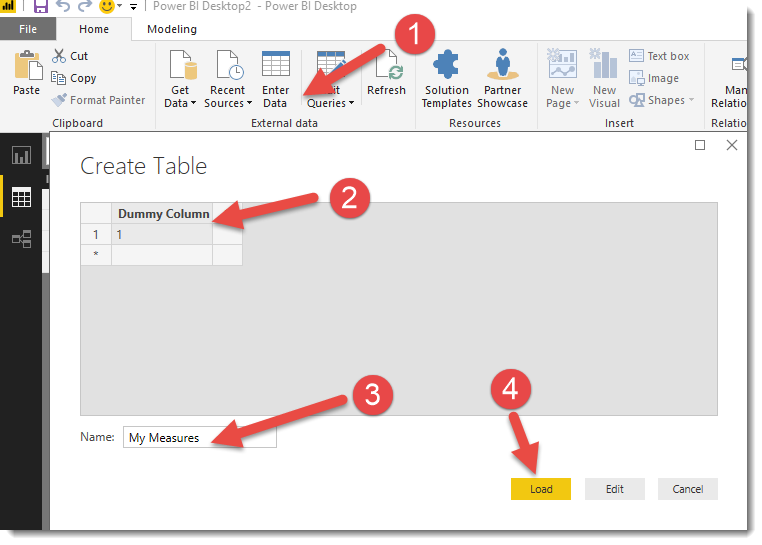
1. In Power BI Desktop, click the Enter Data button on the Home tab
2. Enter some fake data. In this case I added the value of 1 to the first row/column. We will not use this data, it just allows our table to exist.
3. Name your table
4. Load the data
Now you have a new table which you can start moving your existing measures to as follows :
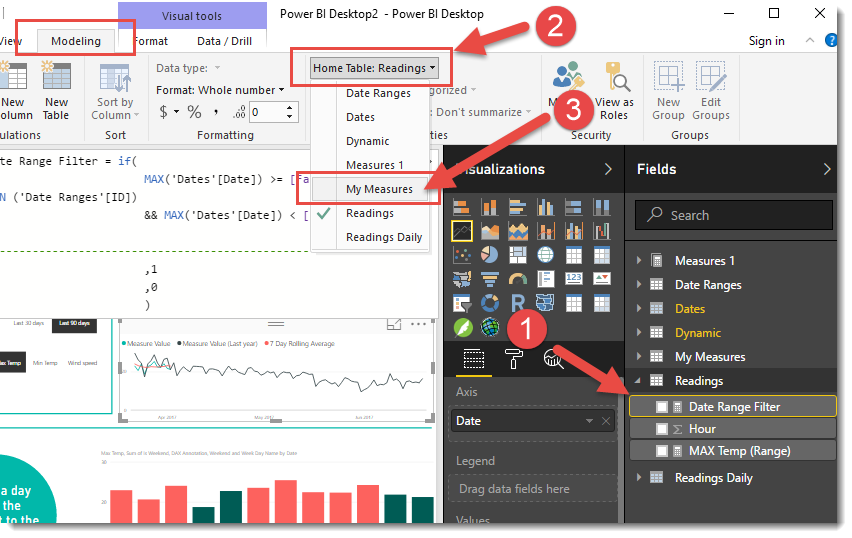
1. Find your measure in the field list and click to select it so it has a yellow border.
2. In the modeling tab, select the Home Table button
3. Choose the name of the new table to be the home table for your measure.
Now repeat for all the measures you would like moved and grouped together.
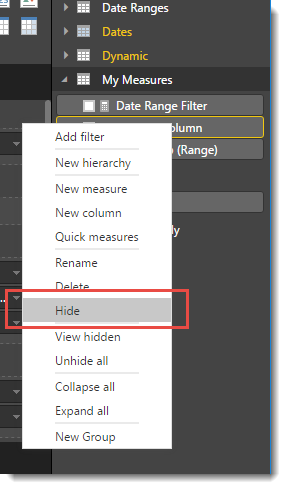
The last thing to do is to hide the column we created when we created the table. You can do this by right clicking the column name in the field list and selecting Hide Field from the context menu.
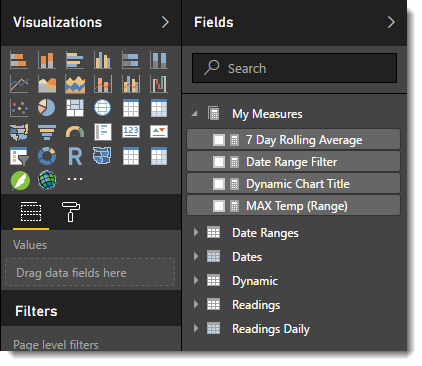
When all columns from a table have been hidden and it only has measures, the table will jump to the top of the field list once you save, close and reopen the PBIX file. The icon for the table should also change to show a calculator rather than a table icon.
And that’s it!
In the following image you can see the My Measures table at the top of the field list showing measures ready to drag into your report.
In SSAS MDX and Tabular models we are lucky to have folders but this isn’t available in Power BI yet. I’m sure it will come. If you have multiple logical groupings of measures you may consider creating multiple measure tables named appropriately. Until then I hope you find this as a useful tip to help tidy up some messy Power BI models.


When POWER BI first came out, I was a little shocked the Display Folders were not a part of the product – especially since it is built off the same technology. I know why it happens, but that is a small consolation!
Great tip! Thanks!
Great tip!
Started using power bi a couple of month ago. I was looking for the way to make use of all the measures in a chart since morning. Tried different things including DAX . Although this blog does not explicitly mention the trick, I got the idea while going through the blog. Thanks for the article.
I appreciate your effort. Amazing tip, i was looking for a couple of hours and now find it in your article.
Thanks once again for sharing.
Cheers Philip!
Awesome workaround mate, owing to the fast range of measures I have developed, its going to safe me a lot of time, and represent my model more professionally.
Thanx,
Lance
Hi,
This works fine but has a disadvantage.
Q&A will rely on the measure to be stored in the fact table. See this video from an expert from the 7m:15s point and onwards. Ehat are your thoughts on this?
Bert
And the video link that I forgot ..
https://www.youtube.com/watch?v=402TOp1sMUA&index=4&list=PL3r-edZ-zQqRno4ZDaPGfsGD_KliFaAfc&t=0s
Has your strategy changed since you wrote this post? I do not need to use Q&A yet, but envision a point where the new ‘Insights’ capability and other ML capabilities as Azure Services will be capabilities I will need to harness. Thanks for any insights on your evolving, updated, approach.
Hi! I’m moving all the tables and measures from Power BI desktop to Visual Studio and will do Live Connection with Analysis Services to Power BI desktop. Is there a way in Visual studio to keep the measures in a separate table when connecting Live? As for now all the messures end up in one data table.
It seems nowadays, you can even remove the dummy column you created !
Hi Reza, just wondering does moving the measure to a separate table impact on the performance of the measures?
Hi Aaron.
Tables are just place holder of measures. It doesn’t matter at all which table holds the measure. No impact on the performance at all.
Great tip man! Thanks a lot!
Thank you very much!
Reza, I was thinking about the number of measures created. In a complex database, a hundred of measures could be necessary. Is it a problem?
Hi Peter
Having a lot of measures is not a problem by itself. Measures are just metadata definitions.
The problem might appear when you use them in visualizations and pages. If you have a page with 100s of complex measures, it will bring the performance of the report down.
Cheers
Reza