 In the previous posts (from Part 1 to Part7), I have explained the whole process of doing machine learning inside the Azure ML, from import data, data cleaning, feature selection, training models, testing models, and evaluating. In the last post, I have explained one of the main ways of improving the algorithms performance name as “Tune the algorithm’s parameters” using “Tune Model Hyperparamrters” . In this post am going to show another way for enhancing the performance using “Cross Validation”.
So what is Cross Validation?
Cross Validation is a model validation technique for assessing how the results of a statistical analysis will generalize to an independent data set. So we are applying the algorithms in different portion of dataset to check the performance. so the process is 1. get the untrained dataset and model 2. partition data into some folds and sub datasets 3. applied the algorithms on these dataset separately it help us to see how algorithm perform for each dataset, also it helps us to identify the quality of the data set and understand whether the model is susceptible to variations in the data. so initially, we follow the below process. just split dataset into 2 separate dataset as below. One for Training and one for testing. 
Now we are going to divide our datasets into multiple folds as below picture. As you can see in the below picture, I have 5 different datasets, which I applied a model to each of them to see what is the performance on each dataset
In Azure ML, we able to do the Cross Validation with the component with same name as “Cross Validation Model” . Cross Validation model works both for training and scoring (testing) the model, so there is no need to add these components (See the below picture)  As you can see in above picture, it get one input from mode (decision forest) and the other input come from
By clicking on the “Cross Validation Model” component, we will see a properties panel that has just two parameters to set, the prediction column that is “real Diagnosis” and the Random Seed. 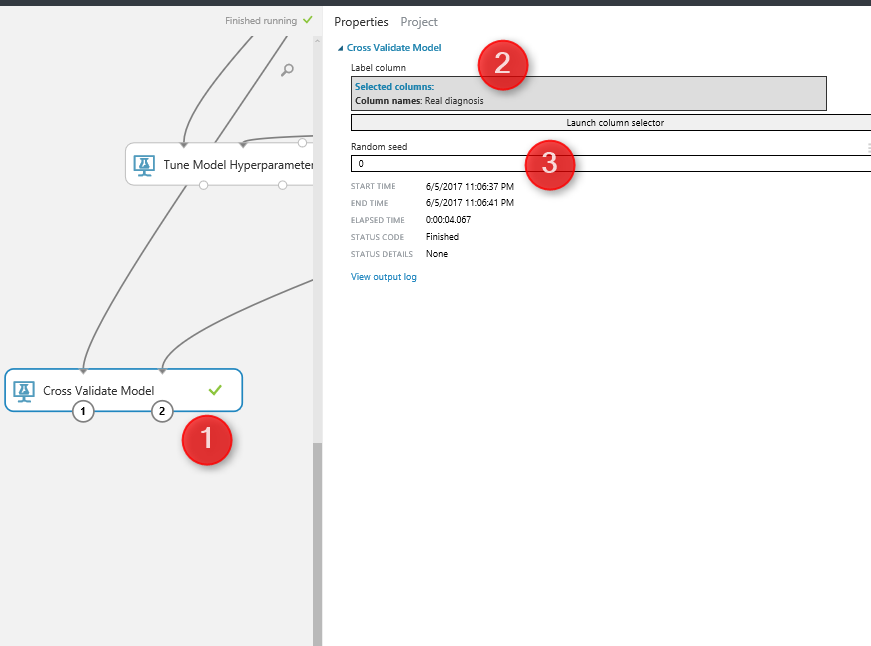
We run the experiment, Then ,by right click on the left side output node of Cross Validation model (below picture number 1), and click on the visualize icon, you will see the result for prediction. 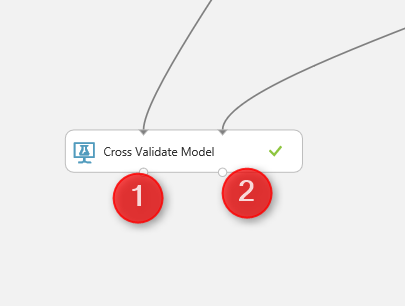
The below windows will show up, as you can see in the first column, the fold number (dataset number) is in Colum 1, and two last columns (column 13 and 14) show the prediction result and its probability to happen.
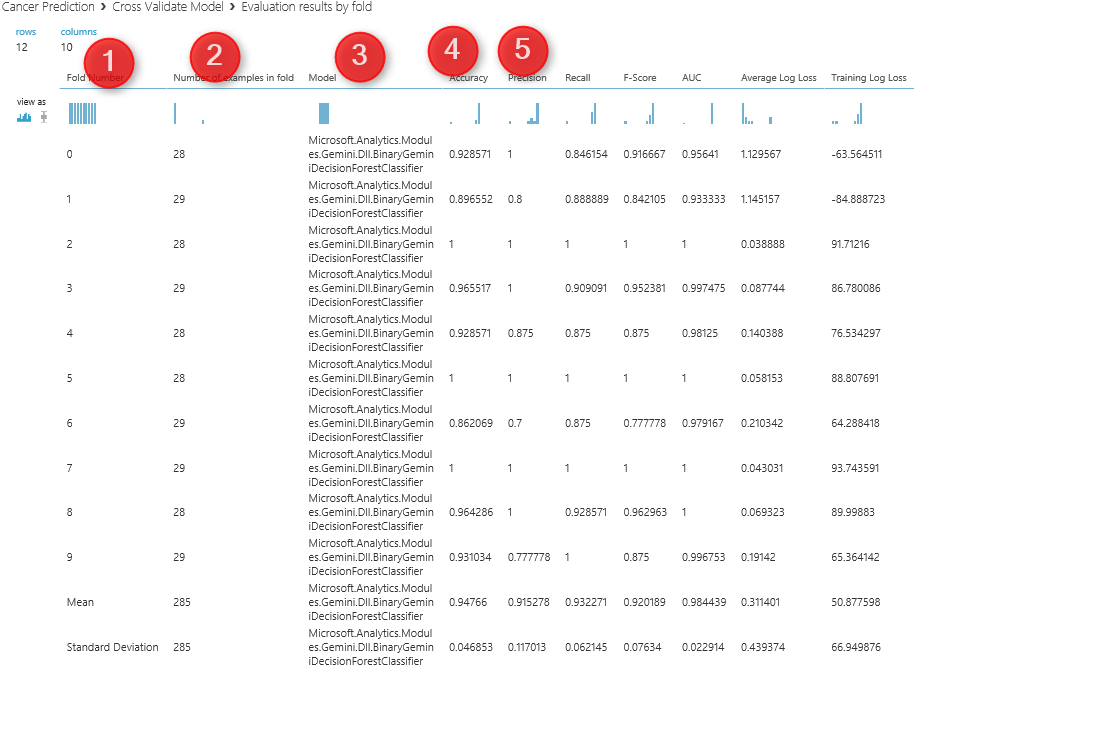
 By clicking on the other output node of the cross validate model, (number 2 in previous picture), you will see the analysis for each dataset (see below picture) so for first column (Fold) we have the dataset number or fold number, the second columns show the number of data in each fold. By default, we have 10 folds, but you can change it using the “Partition and Sampling” component (will talk about it later in this post).The third column is about the model that we run. From column 4 to 10, you can see the accuracy measures that shows the performance of the algorithms on each dataset. so as you look into accuracy in column 4, you will see that the value range from 89 to 1 which good and shows the dataset is pretty well.
  if you wish to specify the number of folds yourself, then you have to use the a component name ” Partition and Sample”. See below picture. This component get one input from split dataset and one output that has the data for cross validation
  if you click on the component, you will see the properties panel in right side.
  As you see in the above picture, there are some parameters that we able to assign. First for Cross validation, I have choose the “Assign to Folds” value for partition and sample mode. Also I have ticked the option for “Random Split” to decrease the possibilities of biased data selection. And finally for Specify number of folds to split I choose 5. so instead of 10 folds of data in cross validation, now we have 5 folds. Also there is a possibility to pass one data fold to cross validation by selecting “Pick Fold” as you can see in below picture
  so we have below process
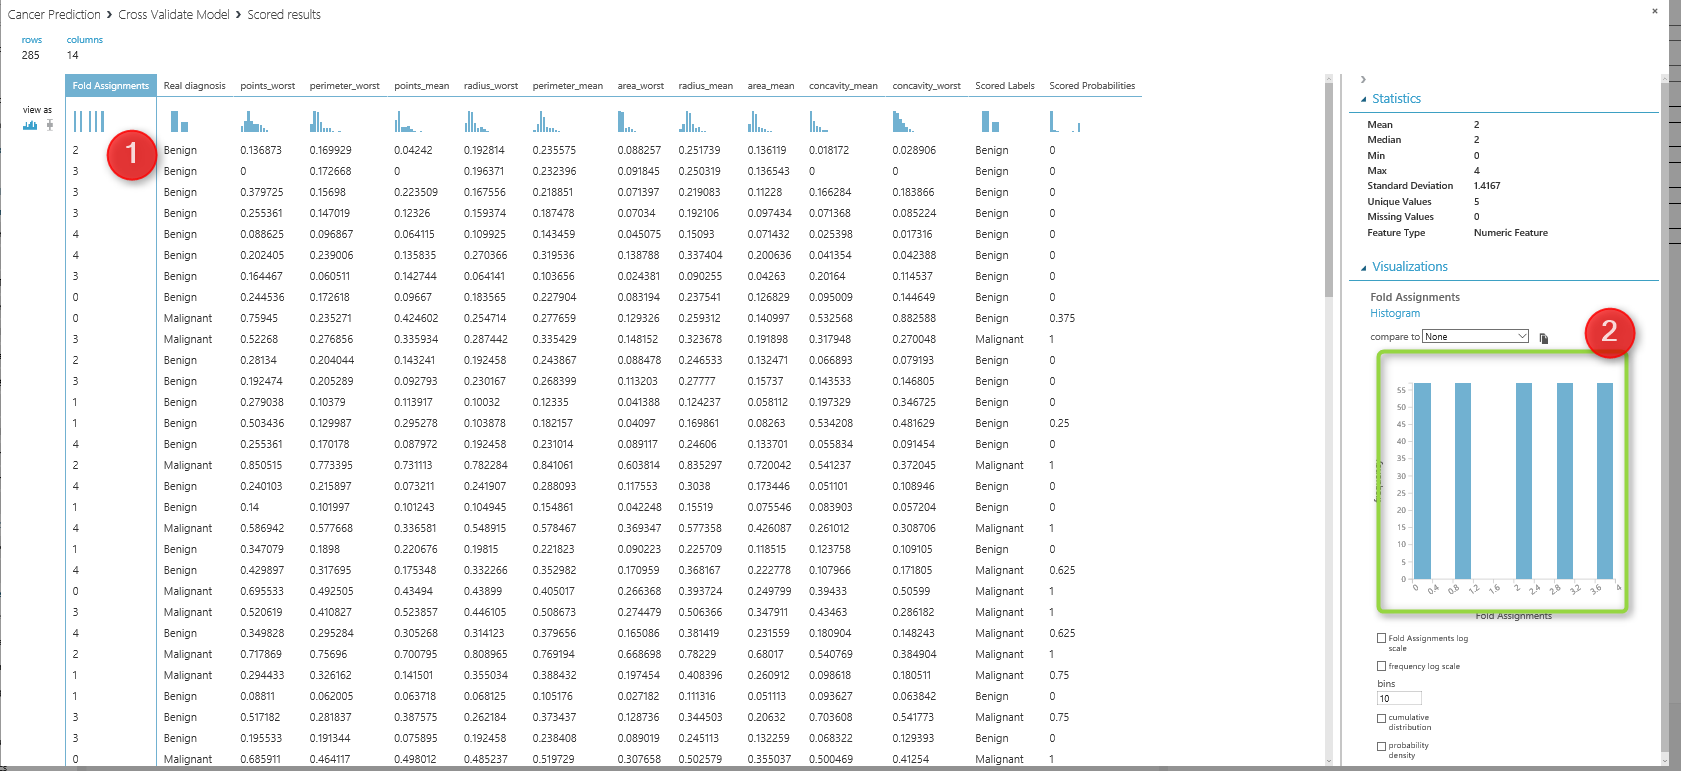
 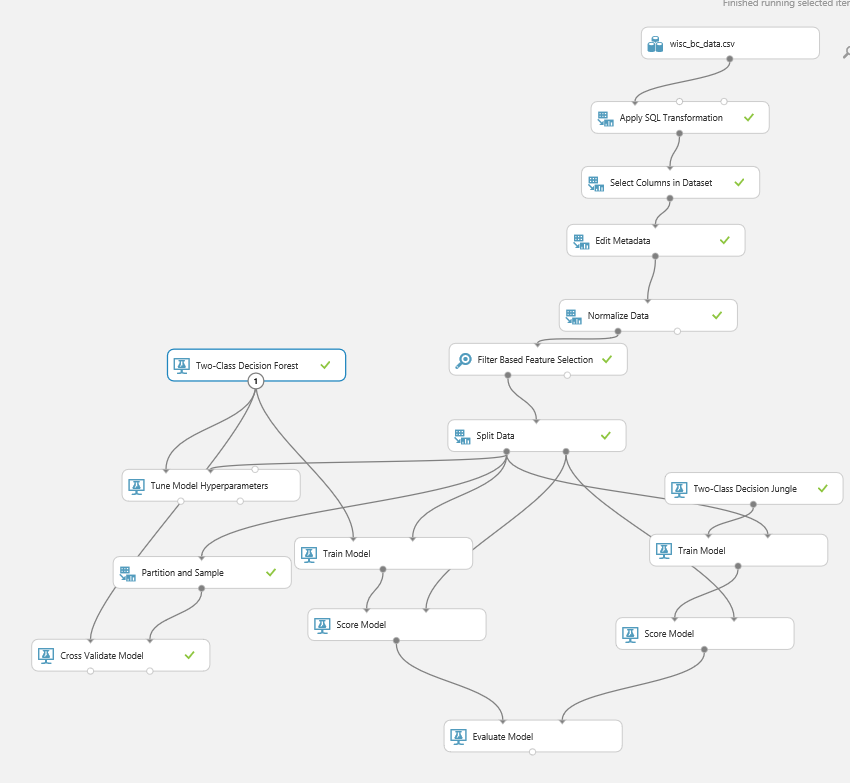 as you can see in above picture, I have connect the output of the partition and sample to the input of the cross validation method. and I run the experiment , so I saw below data. I click on the first column (fold assignment), and in the right side of the windows, There is a chart that shows the summary of data. you see there that we have 5 folds now instead of 10.
  In the next posts, I will talk about the creating web service from azure ml model, how we can use it in Excel or other application. https://en.wikipedia.org/wiki/Cross-validation_(statistics) https://msdn.microsoft.com/library/azure/75fb875d-6b86-4d46-8bcc-74261ade5826


Could you tell more about what actions you suggest we do after “Cross Validation”?
Hi Nine,
sorry I missed your comment, (there was a problem with the portal, did not send me the message to me)
cross-validation is a way to evaluate model performance. Cross-validation has different ways. one way is to have different folds of data and apply the model.