
In the previous article, I explained how you can use GROUPBY function in DAX to create an aggregated table. In this article, I’ll explain how you can use Summarize function for the same purpose. Summarize function gives you more control on how to create your aggregated table with some extra functions. Let’s see how it works. Creating aggregated tables using DAX functions is particularly very useful when creating virtual tables inside DAX measures.
Sample Dataset
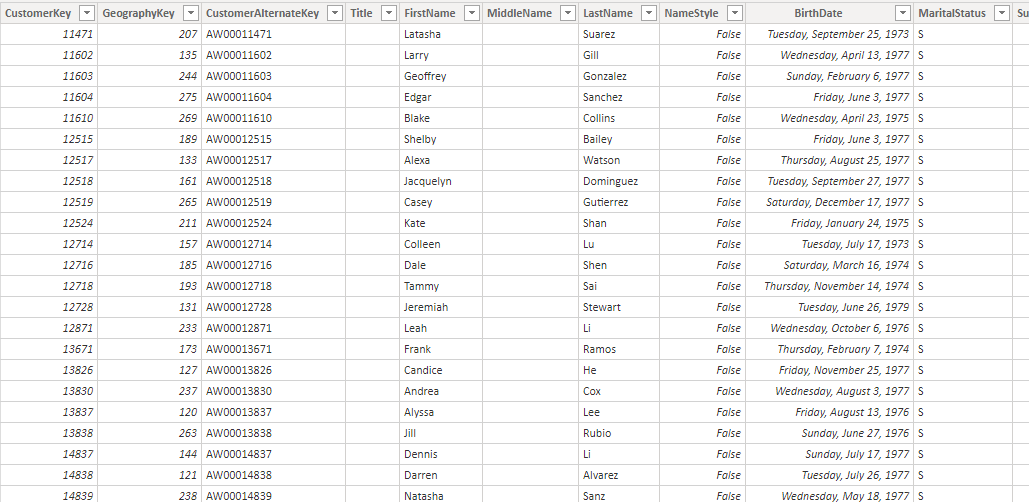
My sample dataset table is DimCustomer as below;
Summarize Function
Summarize is a DAX function that gives you an aggregated result from a table, this is how you can use Summarize function:
Summarize(<table>,<grouping column>,[<name>,<expression>])
- Table; a DAX expression that returns a table, or just one of the tables in your dataset
- grouping column; the name of the column you want to use for grouping
- name; the name of the new aggregated column
- expression; the expression to generate the aggregated column.
Summarize function returns a table as the output. The definition of Summarize function as above looks very similar to GroupBy. However, there are some differences. let’s go through some examples, and you’ll see examples of that.
Summarize: Just Grouping
The simplest way of using Summarize function is using it for only grouping, which will give us the unique list of values of a grouping column (similar to what you can achieve with DISTINCT, or VALUES functions);
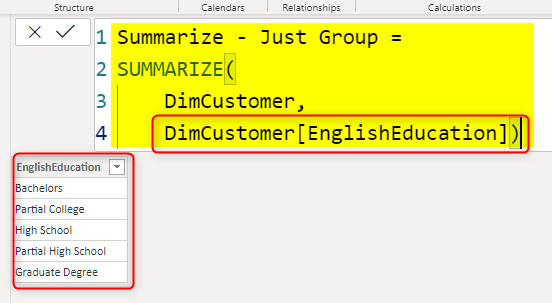
Summarize - Just Group =
SUMMARIZE(
    DimCustomer,
    DimCustomer[EnglishEducation])
The expression generates the below result;
Summarize With Aggregations
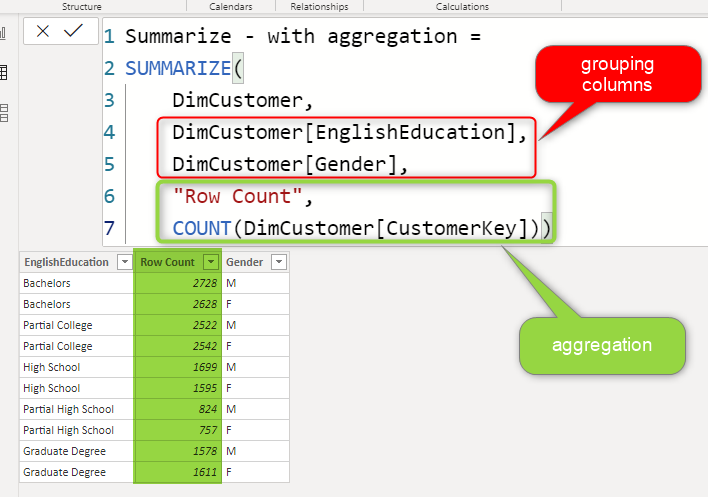
Now, let’s take it one step further, and use it for aggregation. And remember that you can also have more than one grouping column;
Summarize - with aggregation =
SUMMARIZE(
    DimCustomer,
    DimCustomer[EnglishEducation],
    DimCustomer[Gender],
    'Row Count',
    COUNT(DimCustomer[CustomerKey]))
In the expression above, the grouping columns are EnglishEducation and Gender. And the aggregation is the count of customers in each group. The result is the count of customers for each EnglishEducation and Gender as below;
You can have more than one aggregation if you want too. Just add the name of each column and the aggregation expression.
Summarize with RollUp: Totals in the Table
So far, what you have seen was the usage of Summarize in a simple way with only grouping columns and aggregations. That usage is similar to using the GroupBy function. You can, however, using Summarize to add more options to your output table. This can be in the form of totals. Let’s say, you are also interested to see the totals of categories in addition to all other results we had so far, this can be achieved using a RollUp function.
Summarize - with Rollup =
SUMMARIZE(
    DimCustomer,
    ROLLUP(DimCustomer[Gender]),
    'Row Count',
    COUNT(DimCustomer[CustomerKey]))
The above expression, not only create the aggregated result per each Gender, but it also will have one extra ROW in the table for the totals (all genders);
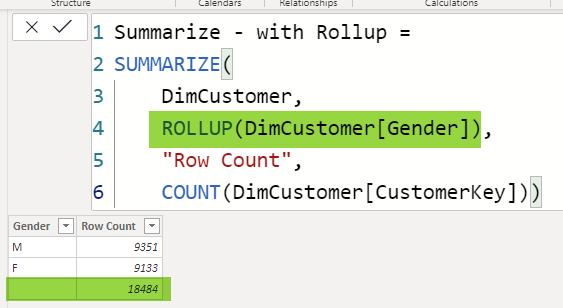
The RollUp comes in the place that the grouping column should be, and it means the grouped results, PLUS the total.
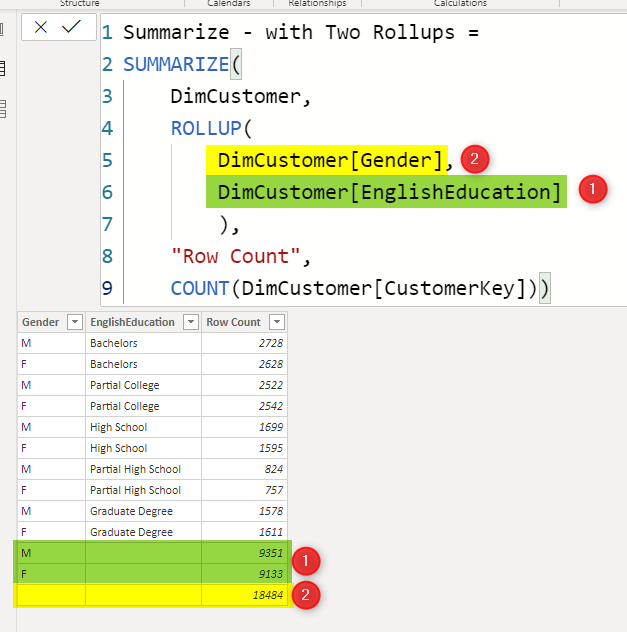
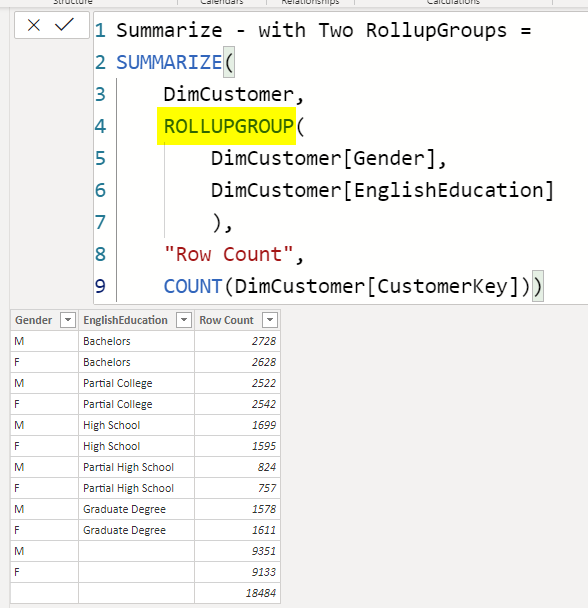
What if Two or More RollUps
Similar to a matrix way of grouping, if you have more columns inside the RollUp, Rolling up values (or total calculation let’s say) is going through them one by one in the order in which they are written inside the RollUp function.
Summarize - with Two Rollups =
SUMMARIZE(
    DimCustomer,
    ROLLUP(DimCustomer[Gender],DimCustomer[EnglishEducation]),
    'Row Count',
    COUNT(DimCustomer[CustomerKey]))
This means that after doing all the grouping, roll up on EnglishEduction first, but with the grouping on Gender (highlighted green below with the number 1), and then roll up on Gender (highlighted yellow below with the number 2);
Changing the order of using columns inside RollUp will change the result of roll-up columns.
RollUpGroup
RollUpGroup can be used similarly to RollUp for bringing the totals and sub-totals into the aggregated results. if we replace the RollUp with RollUpGroup in the previous expression, we get exactly the same result;
Summarize - with Two RollupGroups =
SUMMARIZE(
    DimCustomer,
    ROLLUPGROUP(
        DimCustomer[Gender],
        DimCustomer[EnglishEducation]
        ),
    'Row Count',
    COUNT(DimCustomer[CustomerKey]))
So, you can use either RollUp or RollUp Group to get totals and subtotals.
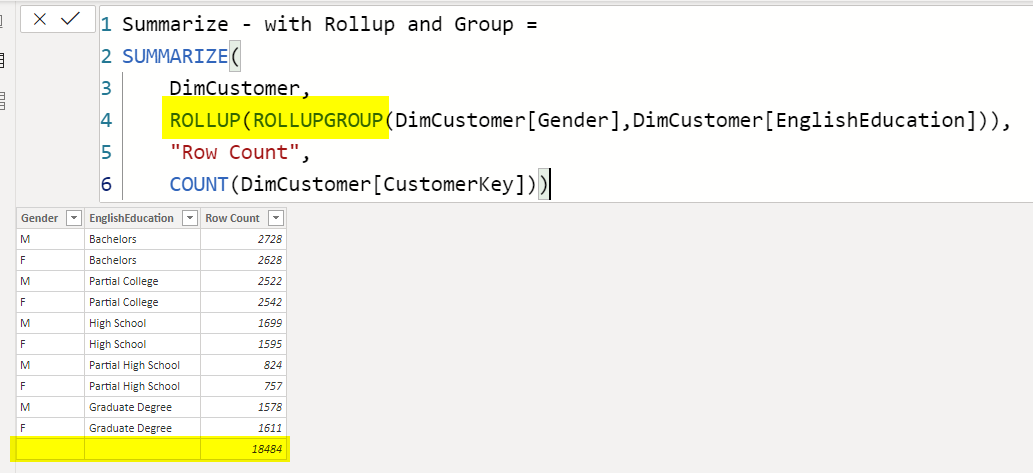
Preventing Subtotals: Combining RollUp and RollUpGroup
One of the main usages of RollUpGroup, is to combine it with RollUp, and use it as a parameter inside the RollUp function. This will lead the removal of subtotal values, and only showing the totals.
In the expression below, you can see that the RollUpGroup is used inside the RollUp function;
Summarize - with Rollup and Group =
SUMMARIZE(
    DimCustomer,
    ROLLUP(ROLLUPGROUP(DimCustomer[Gender],DimCustomer[EnglishEducation])),
    'Row Count',
    COUNT(DimCustomer[CustomerKey]))
The result only shows one total Row;
Checking if the Row is a SubTotal Row? IsSubTotal
Sometimes, you need to check in the result set, and see if this is a subtotal row or not. Let’s say you want to calculate a percentage, and you want to do that only for rows that are not subtotal. There is a function named IsSubTotal, which returns True or False saying that is this row a subtotal row or not.
The expression below has three columns to check is this subtotal of Gender, Eduction or combination of both;
Summarize - with IsSubtotal =
SUMMARIZE(
    DimCustomer,
    ROLLUP(DimCustomer[Gender],DimCustomer[EnglishEducation]),
    'Row Count',
    COUNT(DimCustomer[CustomerKey]),
    'Gender Subtotal',ISSUBTOTAL(DimCustomer[Gender]),
    'Education Subtotal',ISSUBTOTAL(DimCustomer[EnglishEducation]),
    'Total',ISSUBTOTAL(DimCustomer[EnglishEducation])&&ISSUBTOTAL(DimCustomer[Gender]))
The result would have three columns showing where is the subtotal and where not
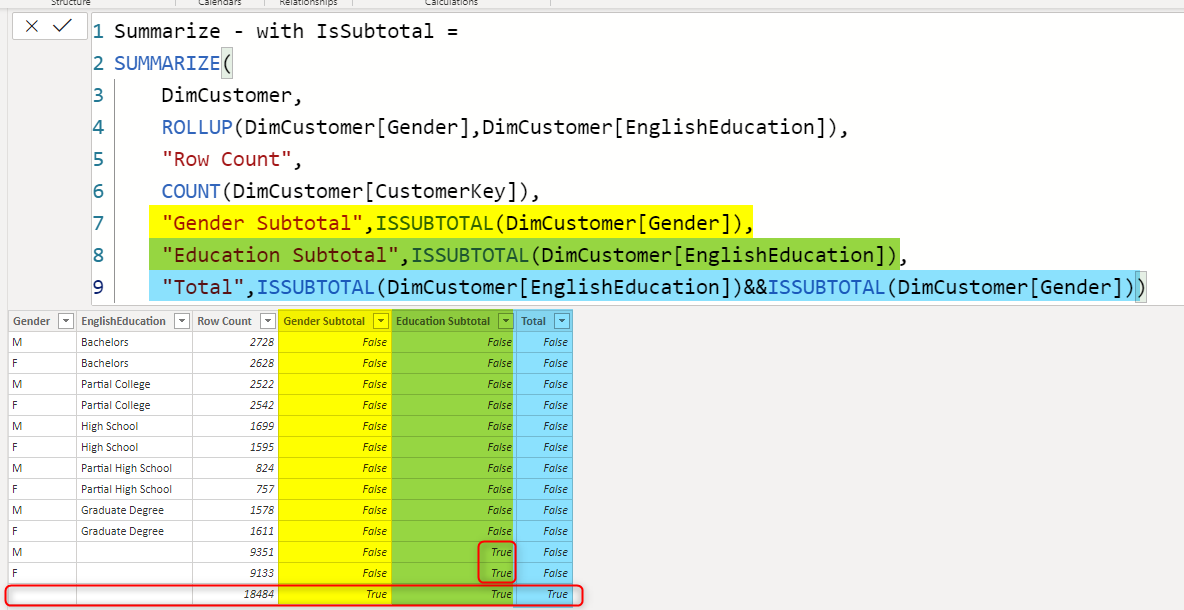
each IsSubtotal used inside a new column, and if the result row is a subtotal on that field, then it returns true for that row.
As an example, If you want to calculate the percentage of the count of customers against the total for every row, but not for subtotal, you can do this:
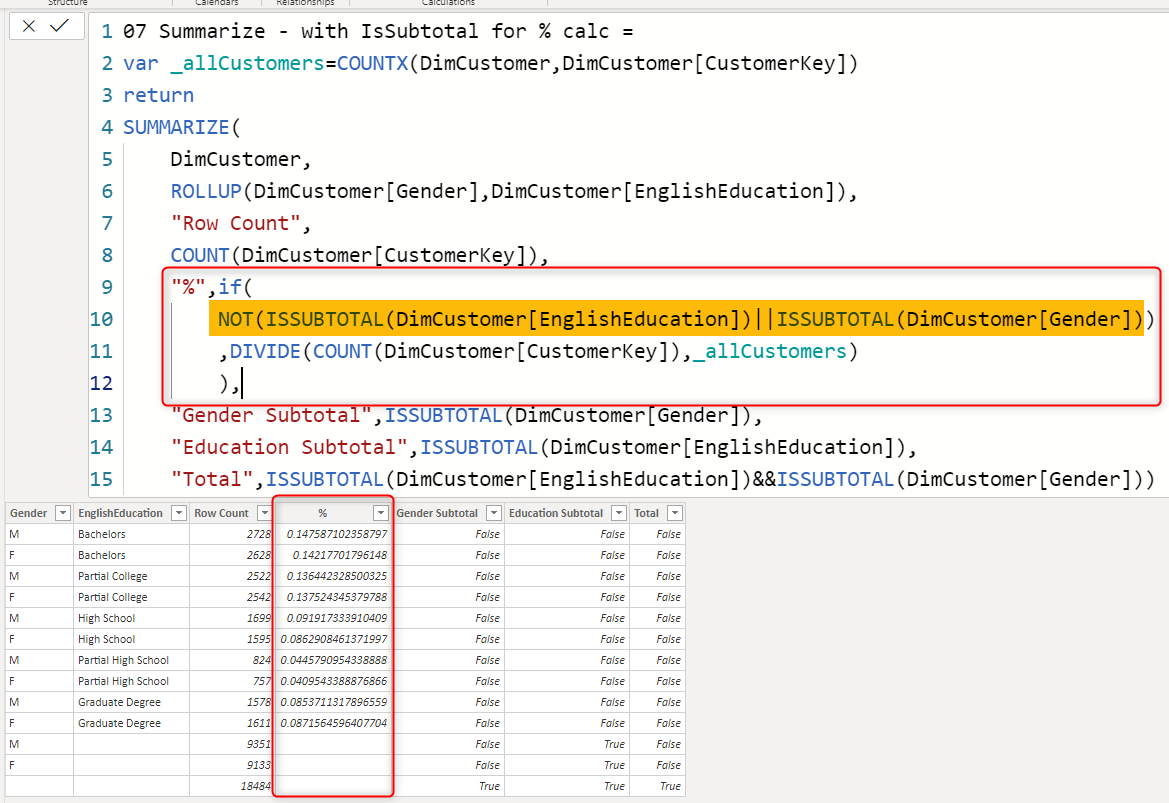
07 Summarize - with IsSubtotal for % calc =
var _allCustomers=COUNTX(DimCustomer,DimCustomer[CustomerKey])
return
SUMMARIZE(
    DimCustomer,
    ROLLUP(DimCustomer[Gender],DimCustomer[EnglishEducation]),
    'Row Count',
    COUNT(DimCustomer[CustomerKey]),
    '%',if(
        NOT(ISSUBTOTAL(DimCustomer[EnglishEducation])||ISSUBTOTAL(DimCustomer[Gender]))
        ,DIVIDE(COUNT(DimCustomer[CustomerKey]),_allCustomers)
        ),
    'Gender Subtotal',ISSUBTOTAL(DimCustomer[Gender]),
    'Education Subtotal',ISSUBTOTAL(DimCustomer[EnglishEducation]),
    'Total',ISSUBTOTAL(DimCustomer[EnglishEducation])&&ISSUBTOTAL(DimCustomer[Gender]))
and the result will be like the below:
Summary
Summarize is another DAX function that can be used to create an aggregated table in Power BI. This function can have advanced features of controlling totals and subtotal with some extra options. You have seen some examples of using Summarize just for grouping, with aggregation, and also using RollUp, RollUpGroup, and IsSubTotal functions. The Summarize function can be used to create a virtual table or a calculated table in Power BI, however, the first one is the one that is used a lot inside measures for dynamic calculation’s purposes.
Download Sample Power BI File
Download the sample Power BI report here:
Video


Reza is author of more than 14 books on Microsoft Business Intelligence, most of these books are published under Power BI category. Among these are books such as Power BI DAX Simplified, Pro Power BI Architecture, Power BI from Rookie to Rock Star, Power Query books series, Row-Level Security in Power BI and etc.
He is an International Speaker in Microsoft Ignite, Microsoft Business Applications Summit, Data Insight Summit, PASS Summit, SQL Saturday and SQL user groups. And He is a Microsoft Certified Trainer.
Reza’s passion is to help you find the best data solution, he is Data enthusiast.
His articles on different aspects of technologies, especially on MS BI, can be found on his blog: https://radacad.com/blog.