
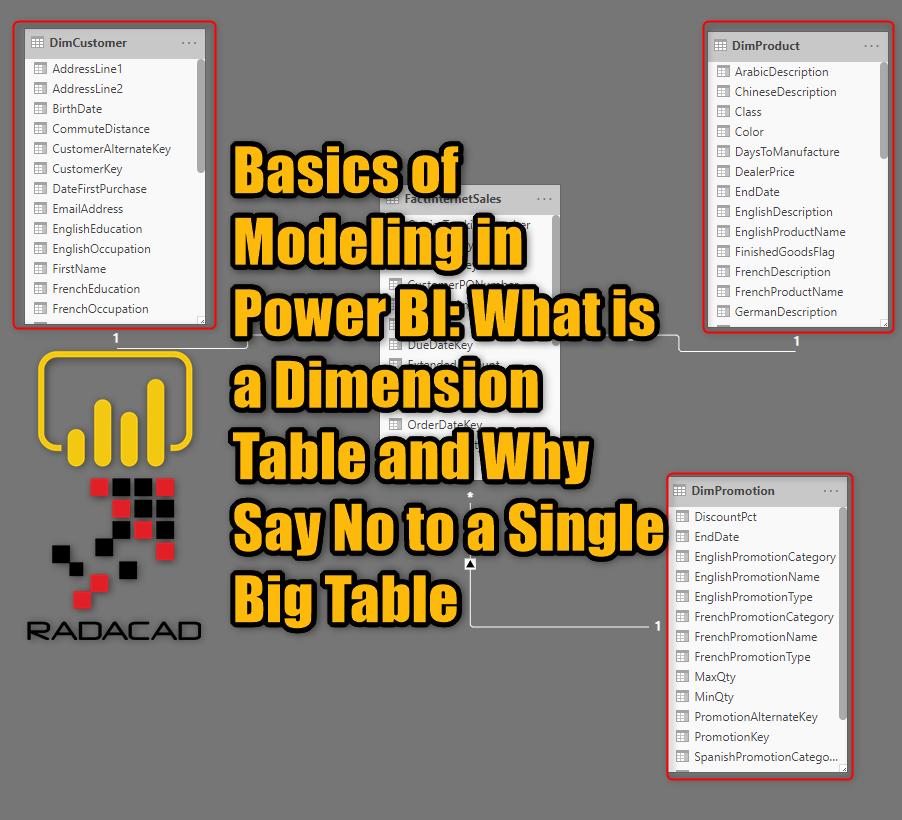
I have previously written about relationships and the cardinality of the relationship. Now is a good time to explain the two types of tables we deal with every day in a reporting data model; Fact and Dimension table. In this article, I will explain what a Dimension table is, and examples of it, and how it can be created. Although examples of this article are all using Power BI and Power Query, the basics of modeling are valid regardless of the tool that you use. If you heard about Dimension and have no idea what it is, or if you haven’t heard about it and you want to build a data model for reporting, this article is what you need to read. If you like to learn more about Power BI, read Power BI book from Rookie to Rock Star.
Prerequisite
There is no prerequisite for this article. However, I highly recommend you to read below articles beforehand;
What is the Cardinality of the Relationship?
What is the Direction of the Relationship?
Data preparation; First and Foremost Important task
Two Types of Tables
In a reporting data model, there are two types of tables. Before I go further on this, I have to point out that there is a big difference between a data model build for a transactional or operational system, compared to the data model build for a reporting system. In this article, we are focusing on a data model for reporting systems, If you want to understand why it is different from transactional data models, read this article. In a reporting data model, we have two types of tables; Fact table, and Dimension table;
A Fact table is a table that keeps numeric data that might be aggregated in the reporting visualizations.
A Dimension table is a table that keeps descriptive information that can slice and dice the data of the fact table.
The definition above, although correct, can lead to creating heaps of different type of tables and calling those a Dimension or Fact table. You do need to understand where and how a Dimension table can be created, what are rules of thumb for creating such a table, and what is a good dimension, and what is bad. and that is what I’m focusing on this article.
A Type of Field: Descriptive
A Dimension table is a table that has descriptive information, which is or can be used for slicing and dicing. A Dimension table has fields that are descriptive. Descriptive fields can be of datatype text, date and time, or even a number. Let’s have a look at some examples;
The table below is a table full of information about customers, and they are all text data type information;
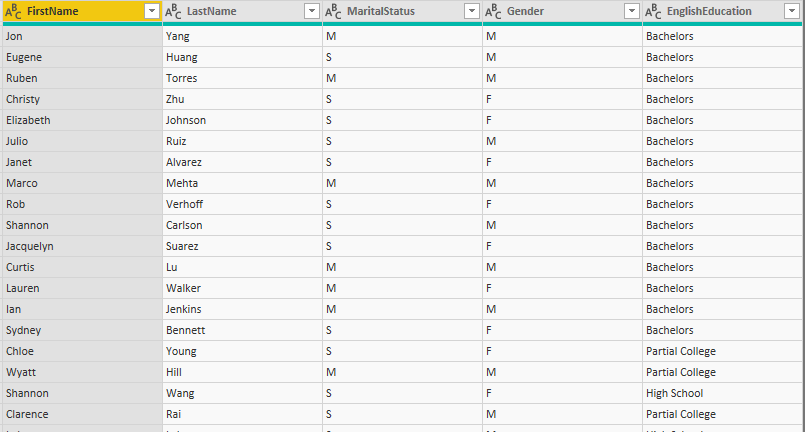
This is a Dimension table because you use the data of this table mainly in visualizations like this:
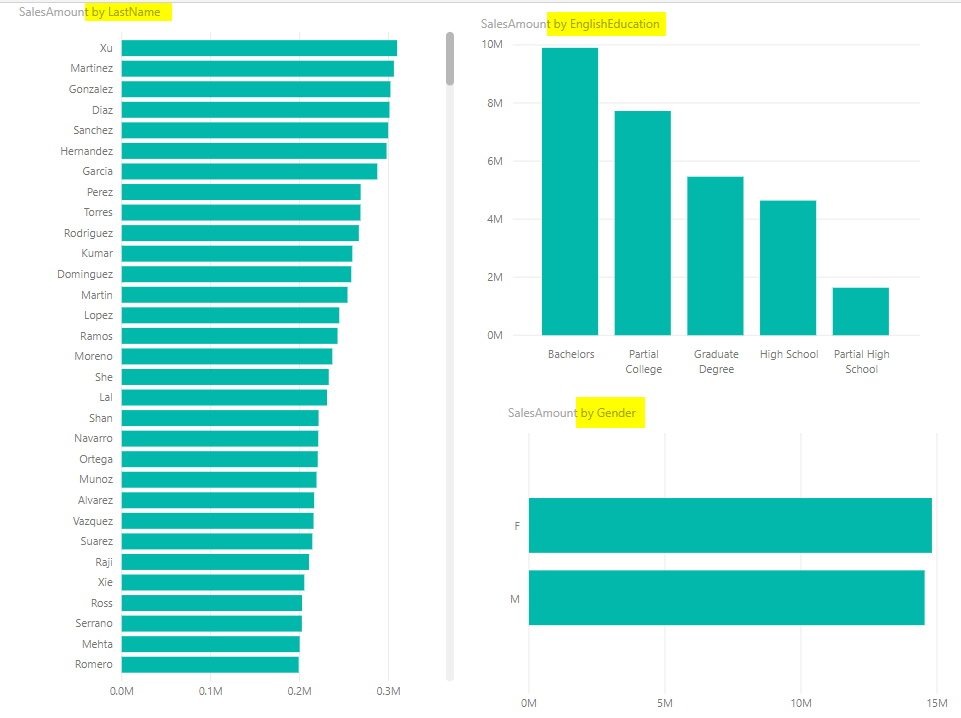
Most of the times, you use values from this table in an axis or legend of a chart of visualization, but not as values. (You might use these as values in the table visual, but that is an exception, table visual, will show you everything). In the screenshot above, the value is SalesAmount (coming from a different table), and it always sliced and diced by a field from the Customer table; Gender, EnglishEducation, Lastname, etc. That brings us to the first part of the definition of the dimension table;
Fields from a Dimension table are always used for slicing and dicing data of other tables (either through filters or slicers, or through axis or legend of the same visual), We call these fields, Descriptive fields.
You also found that fields of the Customer table above were all text. That can be different, let’s check it out here; we have two new fields in the Customer table now;
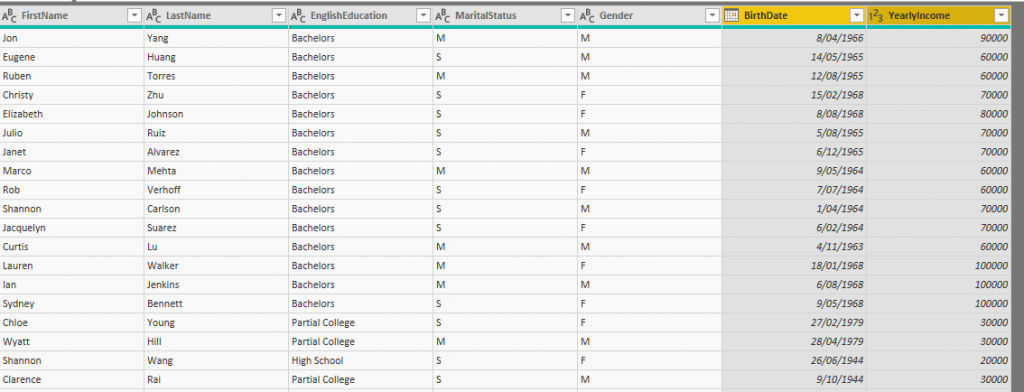
The date field (BirthDate), and the numeric field (YearlyIncome) will be also used for slicing and dicing as the below screenshot shows it;
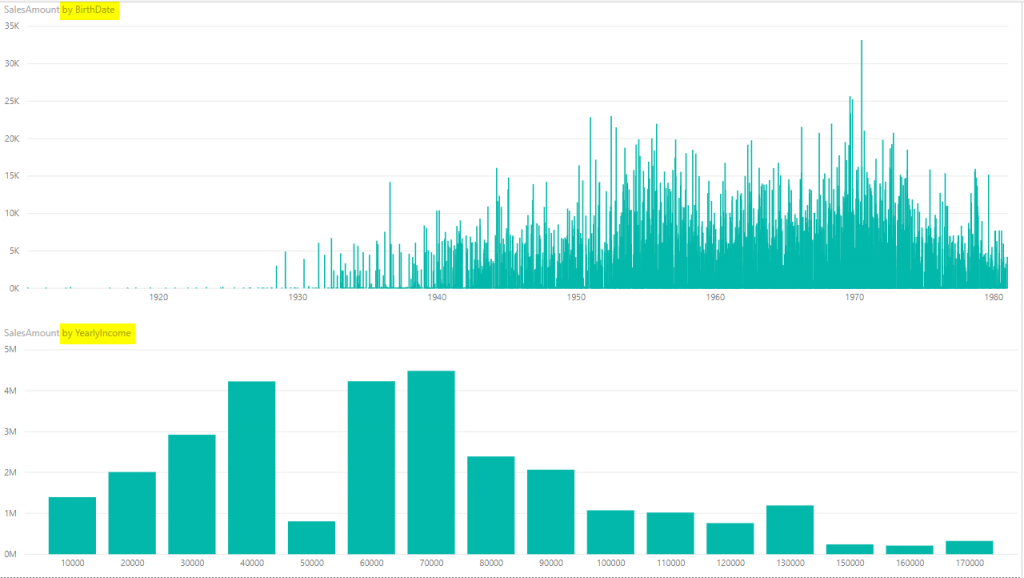
No matter you have date and time fields or even numeric fields in the customer table, they are used in the same way as text fields, they are used for slicing and dicing.
The data type of the descriptive fields can be text, date and time, number or anything else. The data type is not the important property of these fields, the nature of use case for them is important, which is slicing and dicing.
Another Type of Field: Values
Descriptive fields are not the only type of field that we work with it in a data model. There is also another type of field, which is called as Fact. These fields are not used for slicing and dicing. These fields are used as VALUEs in the visualization. In all visualizations above, there was a field that was the Value part of the visual: SalesAmount.
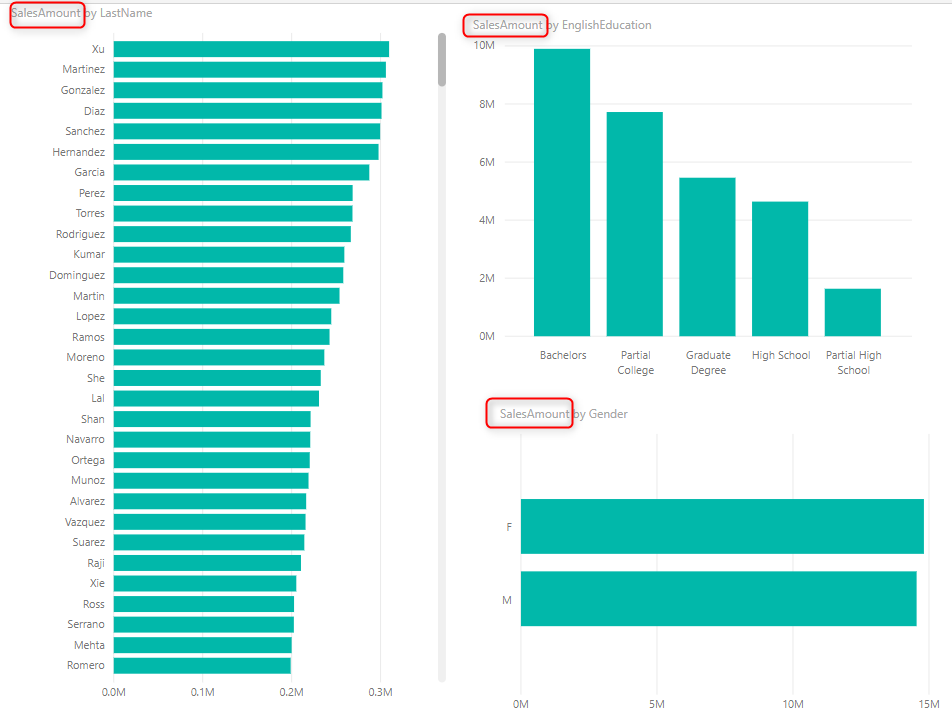
SalesAmount is not used for slicing and dicing. It is used as a value. In fact, SalesAmount is sliced and diced by the descriptive fields of Gender, Education, and Lastname. SalesAmount is not a descriptive field, it is a field that used as a value, and can be aggregated sometimes (like what you see in SalesAmount by Gender or SalesAmount by EnglishEducation). SalesAmount is a FACT field.
Fields that are the VALUE part of a visualization (not for table, and a few other visuals), and sliced and diced by descriptive fields, often aggregated are FACT fields.
Golden Rule: Fact and Descriptive Fields Not in the Same Table!
Now that you know what is a Fact field, and what is a Descriptive field, it is time to explain the first golden rule: Keep these two types of fields away from each other, in separate tables. Fact fields should be in a table which does not have Descriptive fields in it and vice versa. Your first question I believe then is Why?! Well, let’s see.
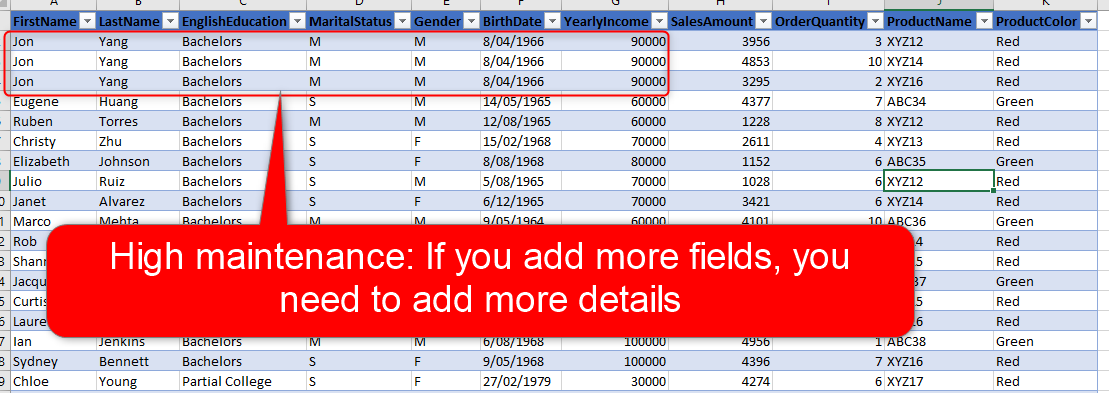
Let’s assume that we have a table with both types of fields; descriptive fields and also fact fields, like below;
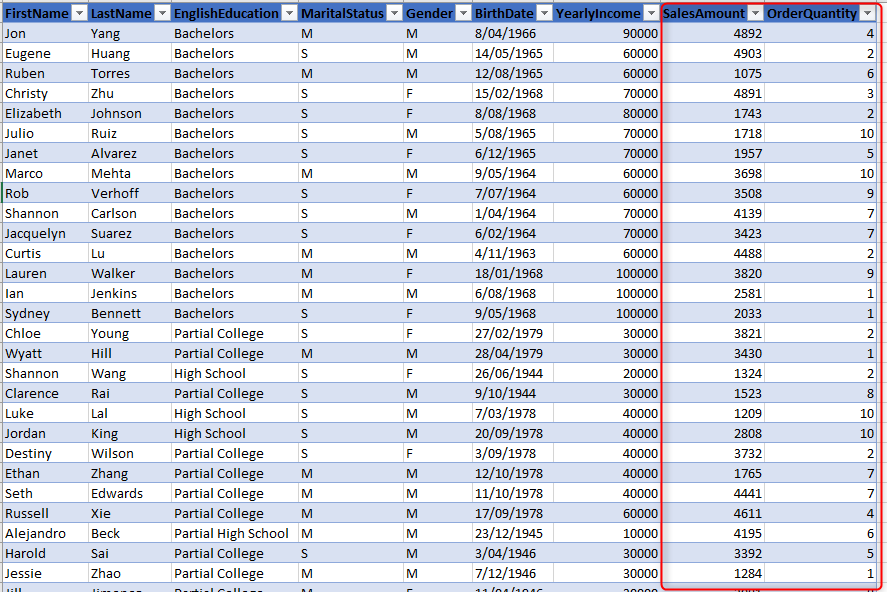
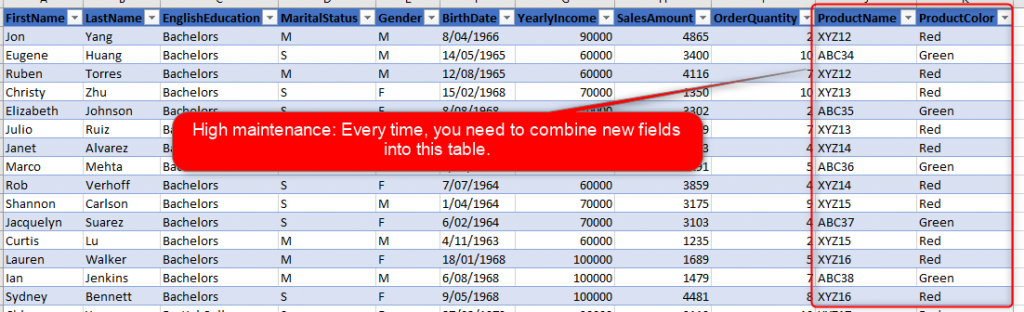
All the seven first fields are descriptive fields, and the last two (SalesAmount and Order Quantity), are fact fields. Using it in a model like above works fine, and you can slice and dice the data of fact fields, by descriptive fields. However, what if you bring another set of descriptive fields, which are not part of this table? for example, what if you want to slice and dice the data of the fact fields by some fields from the Product table, such as ProductName, Color, etc? Then you end up bringing all those into this table too, and end up with a super large table, which has customers, products, and sales values! What if later on, you want to bring dates of the transactions, sales promotion, store details? each of these brings a whole lot of fields with themselves.
Say No to a Single Table Including Everything!
One of the other golden rules of data modeling is to say no to a scenario like above to happen. Do not bring everything into one large table with hundreds of columns. There are several reasons for that, I just point a few;
- Maintenance of such a big table would be always a challenge. Every time you bring a new set of fields, you have to combine them into this table.
- The level of details stored in this table is dependent on the fields in it. If you bring new fields, you need to store more details! This is also a maintenance problem.
- Combining is not always possible! What if you also want to bring a budget into the same table? most of the time is not possible, because you may not have the budget data in the level of customer, you may have it only at the level of the month, and product. then you end up with multiple very large tables.
Maintenance Challenge
Every time, you add new fields, your table needs to be combined with the new table to have everything in one place!
The level of Details is dependent on the fields in the table! If you add more fields, you need to store more details.
Combining is Not Always Possible
If the level of details in one or two fact fields is different, then you cannot store them in one table easily. You have to split into two;
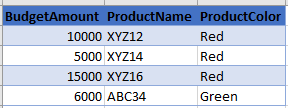
This can become another big table, adding dates, and more details about the product, etc. and then you need to create a “many-to-many” relationships between the two tables, which cause heaps of other issues! If you like to learn more about many-to-many relationships, read this article.
So it is not possible to have one table with everything in it, and as you realized it is better to decouple the fact fields from the dimension fields. because then expanding the model is much easier, and it won’t need a really high maintenance practice.
Dimension Table
Now it is time to go back to the definition of the dimension table;
Dimension table is a table full of Descriptive Fields and zero Fact fields.
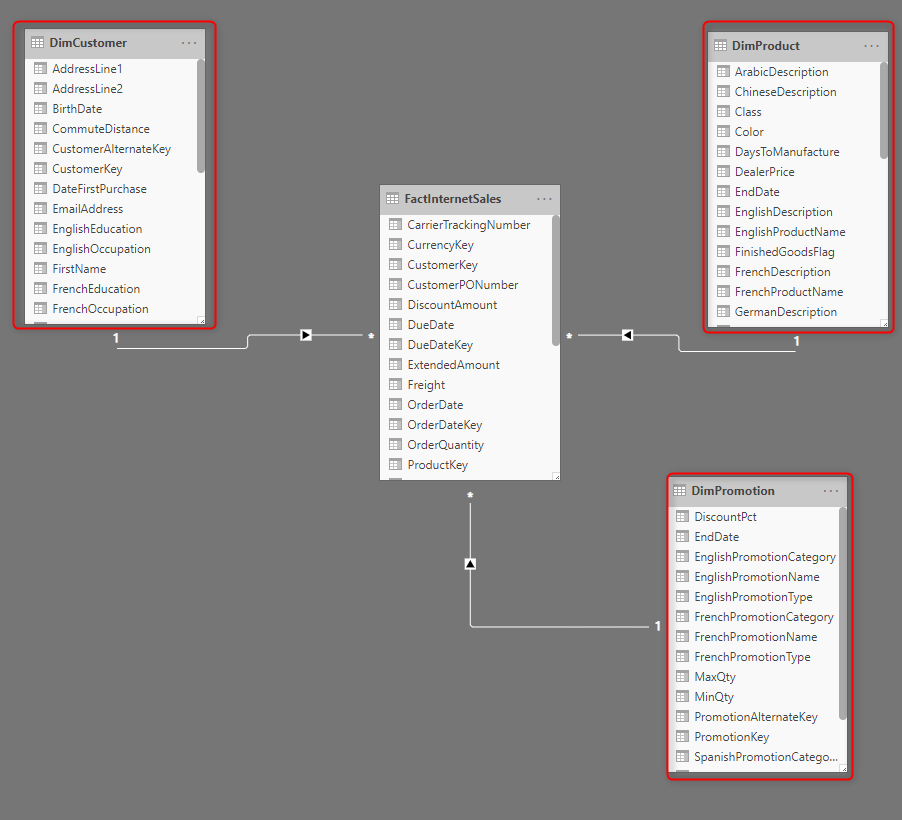
This table needs to be related to other tables including Fact fields to slice and dice their data. so this table needs to have a field which is the unique identifier for each row. This field in database design practices is called as Primary Key. Primary Key is a single field or combination of fields in the dimension table, that can uniquely identify each row. For example, the Customer table can be identified with the CustomerKey column as below;
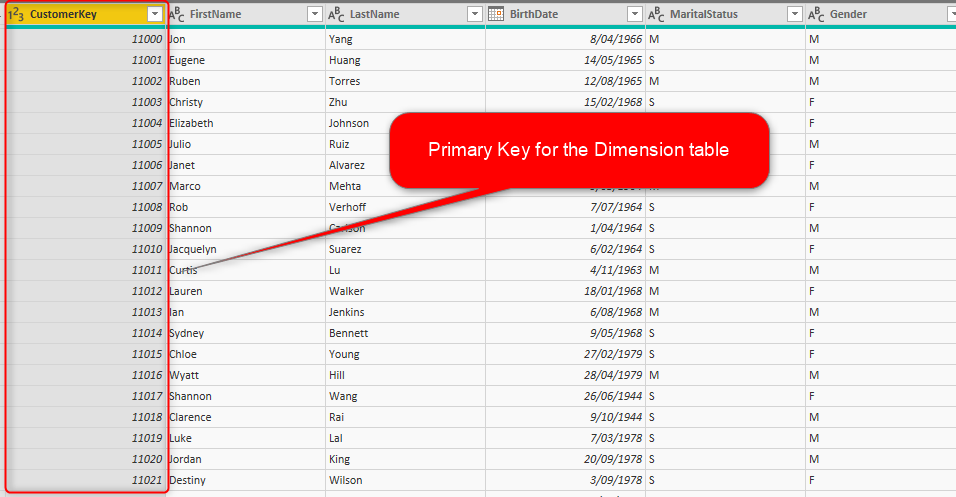
This is the field, that will be used for the relationships of One-to-many between dimension table and fact tables.
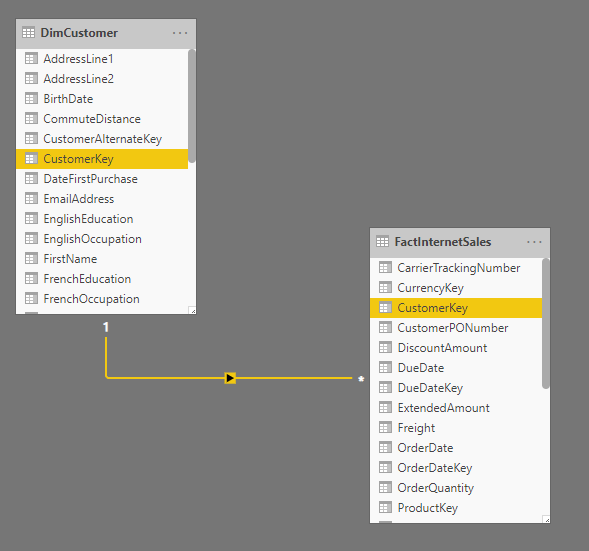
The relationship between Dimension table and Fact tables most of the time is One-to-Many from dimension to the fact table. There are instances of having a one-to-one relationship as well, but not very often.
So, we need to change our definition a bit now;
Dimension table is full of Descriptive fields and zero Fact fields, and one or more Key fields. Key fields are row identifiers of the dimension table.
If you have more than one key field (it is also called a compound key), then you cannot create relationships between tables in Power BI using multiple fields, so you need to use a workaround like what I mentioned here, to create a single field for creating relationship.
When the Primary Key is Not a Primary Key!
The Primary Key is a column (let’s assume it is only one column for this example), that is row identifier. However, what if it isn’t!? Do you recall in your use cases a scenario that something has to be a primary key, but it can’t be? Let me tell you an example; In a reporting model for bank information, we have a table of credit cards. Each credit card has a unique number, so can be used as the primary key;
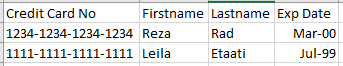
However, if you look more in details, a credit card will be renewed every few years, with a new expiry date, but the same number!
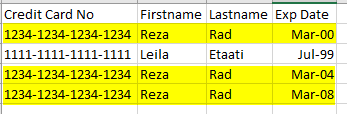
This is an example of a field that should be somehow primary key (or maybe it is already a primary key in the source operational system), but not in our model. we call these fields; Alternate Key, Business Key, or the Primary Key in the source system. And then we need to create a new field in the Dimension table which can be a real primary key. A primary key of the dimension table, because of this reason is called Surrogate Key, and most of the times can be generated as an auto-number index value;
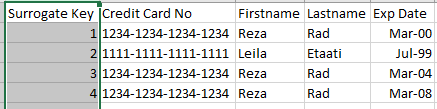
There are other scenarios that you might end up creating an auto-number surrogate key for your dimension as well. This was just an example to clarify things for you. If scenarios like this happen, most of the times, you do need to also keep the Alternate Key beside the Surrogate Key in the dimension table for slicing and dicing.
Dimension Tables are Wide
Another golden rule in designing dimension tables is to make them wide. Add fields that are related to that, more fields in the dimension table means more power for slicing and dicing the data. If you have just three fields of Customer first name, last name, and gender, then it means you can only slice and dice data by these three. However, if you have a customer table with all columns below, then you will have much more power in slicing and dicing;

Dimension tables have many fields, and that is why they are Wide. And wider means more slicing and dicing power.
Dimension Tables are Shallow
Dimension tables, also wide, but often, they are shallow. They do not have many rows. They are often less than a million row. However, there are always exceptions. For examples, if FaceBook wants to create a customer dimension, it would be hundreds of millions of rows for sure. A dimension table is not storing transactional data, it is storing descriptive information. Transactional data is what it makes the number of rows to grow.
Examples of Dimension Tables
Based on what you learned so far, you can now name some dimension tables in your scenario. It is not a generic dimension table, a table might be a dimension in one model, and with some difference in the set of the fields, might be a fact table in another model. Here are some samples of dimensions, and their fields;
Customer: CustomerKey, First name, Last name, Full name, Age, Gender, Job title, etc.
Product: ProductKey, Product Number (Alternate key), Product Name, Color, Size, etc.
Store: StoreKey, Name, Address, etc.
Summary
I can write about the Dimension table even much more, as there are lots of details to talk about. However, let’s leave the rest of that for the other parts of this series of Modeling Basics. In this article, you learned that there are two main types of fields; Descriptive and Fact fields. These two fields should not be at the same table. So that is why we have tables with Descriptive fields and call them Dimension tables. Dimension tables also have key fields called surrogate key as a row identifier. The relationship between a dimension table and fact tables are one-to-many. In the next article, I will explain what is the fact table, and how it connects to a dimension table.
Do you have a table with both fact and descriptive fields in it? it is time to split it, if you have any questions in doing it, let me know in the comments below.


Reza is author of more than 14 books on Microsoft Business Intelligence, most of these books are published under Power BI category. Among these are books such as Power BI DAX Simplified, Pro Power BI Architecture, Power BI from Rookie to Rock Star, Power Query books series, Row-Level Security in Power BI and etc.
He is an International Speaker in Microsoft Ignite, Microsoft Business Applications Summit, Data Insight Summit, PASS Summit, SQL Saturday and SQL user groups. And He is a Microsoft Certified Trainer.
Reza’s passion is to help you find the best data solution, he is Data enthusiast.
His articles on different aspects of technologies, especially on MS BI, can be found on his blog: https://radacad.com/blog.
Than you for sharing Reza, this was very informative
Nicely done!
Thank you for the very informative article. One question: if a data model required multiple “surrogate” primary keys among various tables, should they be labeled via alpha-numeric names (to ensure uniqueness) rather than simply using numbers / letters ?
Hi Jay,
Yes, you can have multiple surrogate keys. You would have one surrogate key per dimension table. However, you don’t need alpha-numeric names, they can be simply named as CustomerKey, ProductKey, or things like that.
These columns will be later on set as HIDE in report view in Power BI.
Cheers
Reza
Thanks for this article. I now understand how dimensions are created. Could you please also describe how a Fact table is “born”? For me that way harder to understand. Also, ho do you get the surregatkey (form dem DIm Tables) into the Fact table, so that querying the data will work.
That’s still a “black whole” for me and I have no clue.
Many thanks so far for your help.
Cheers
Alex
Hi Alex.
That would be the next part of this series. Stay tuned
Cheers
Reza
Great article! Question that our team has been considering… we currently have several instances of Power BI reports that require multiple fact tables (and corresponding dimensions) to suppor them. Two questions
1) We are sharing dimensions between the facts – we had heard before this wasn’t a good idea (and had duplicated the dimensions so there were 2-3 separate star schemas within a Power BI report) but are now sharing one set of dimensions between the facts. Is that a terrible plan?
2) What are your thoughts on using something like a VIEW to pull the fact/dimension data into Power BI? Is it best to use the relationships in Power BI to define how tables are related, or use more traditional JOINS in a view and have Power BI ingest just the view?
Hi Faere,
you SHOULD be sharing dimensions between fact tables. If you don’t do that, then how you can filter data from two fact tables using a single dimension?! You can have shared dimensions as I mentioned here, and still, every data mart (the combination of fact and dimensions) would be star schema.
Using the Views are fine. However, at the end of the day, if you have multiple tables in the Power BI model, you need to create a relationship between them. That doesn’t matter if you have the relationship already between tables in the database or not. That is a relationship in the model to handle in-memory tables to be sliced and diced by themselves.
Cheers
Reza
This is related to my question which is related to previous post here about multiple fact tables and bidirectional filtering. If the fact tables are also related to each other, then it becomes problematic for them to share a dimension table, right? So far I only had this issue with a very small dimension table, which I flattened into the main fact table as a single calculated column (essentially decreased maintenance but a a heavier table since there are 500,000X more rows). Was that the right move? Everyone wants to filter in every direction these days!
Hi.
Flattening dimension tables with the fact table is not a good practice, and I vote highly against it. even if your dimension table is small. The main reason is that after few months or years, you get to a point that you will need that small dimension table now in another fact table, and then end up creating silos of big fat fact tables including everything with the issue of creating a many-to-many relationship in between.
for the last part of your message “Everyone wants to filter in every direction these days!”. Yes, I know that. However, we need to understand why people want to filter in every direction. when you get the WHY, you can design a better model. For example. people want to know the count of products which have not sold, this from my point of view is not a dimension attribute. It is a fact which has to be moved to the correct fact table for it.
Cheers
Reza
Hi Reza,
Great article thanks.
How do you happen the case where you have a value in the dimension table that needs to be used for calculation? Eg a product cost in the product dimension table that you want to use in a total transactions profit calculation.
Regards
Dave Easey
Hi Dave.
Then that value is not a dimension anymore. If you have a cost associated to the product, and you want calculations and aggregations on that. I say, then you need a fact table for that too. Also, a product cost through the time changes, because of the material changes. so you will need to have a fact table to have also dates associated with each cost too.
Cheers
Reza
Thanks Reza,
The penny is dropping. Your answer together with other reading that I should have a separate dimension table for the Year (time granularity of my budget table), is finally getting me to an elegant simple solution. Before this I’d spent days and days of effort attempting to created convoluted measures to compare cost and budget. A big relief.
Regards
Dave
Great to hear that Dave
I will be writing an article soon about a budget vs actual scenario soon too
Cheers
Reza
Нi Reza!
Is this what You said to Dave also applies to the total customer number? Like for example, I would need a forecast of new customer growth over time. Would You say, the ‘count od customers’ becomes a fact in this contexts and should have a separator fact table (CustomerMetrics or sth)? Should I use a calculated column and end up with a fact table that looks like this?
dateKey | customerCount
What about just creating a custom metric for counting these customer rows and use this metric with a date to make a forecast. Wouldn’t this be a simpler solution?
The same thing applies when You want for example total customer number sliced by date and acquisition source. Should one just use a metric or should one make a separate fact table for customer count
Anyhow, I’m a huge fan of Your work, thanks for the great content You are making!
Hi Konrad.
Very good use case you mentioned to discuss here.
The fact table should explain the “happening of an action”. In the case of customer acquisition as the BI problem to solve, your fact table should either show when customers purchased or signed up, and then the total count based on their date of signing up can be all fetched there because the date and customer connection would happen in that customer acquisition fact table.
Cheers
Reza
Hi Reza.
Thanks for answering. So, if I understand correctly, It’s totally fine to have a Customer Aquisition Fact table.
I also heard that one should never connect 2 fact tables with a direct relation. In my case, I would need to connect customers with their orders (sales facts)
Should I connect customer facts with a customer dim, and then customer dim with sales facts? What would You recommend as a best practice?
Good day, and thanks again!
It is absolutely fine to even have ten fact tables. but fact tables should not be connected to each other.
each fact table explains the happening of an action. the action depends on many attributes that are described in dimensions. your dim customer can be connected to both fact table with no problem. but the fact table themselves not needed to be connected to each other. and your reporting questions should be answered by this design. if not, the design might need some changes.
Cheers
Reza
Hi Reza,
Thank you so much for these really high-quality resources free to the community. I can see I need to make some radical changes to my largest model. But in reading these posts I am feeling a lot more confident that I will be moving forward into best practice. You are a champion!
I cave a table that have the following columns:
1. Date and time.
2.Meter name (this having 30 different meter names for 30 locations, each location have those 30 meter names)
3. sites (30 different sites)
4. Value (for each meter, for each site, for each time and date)
5. Last years values (just the last year value of the “Value” column.
So my fact table sould include the value and last year’s value, and the rest on the dims table, but what would be the Pri-Key?
Your last year value simply should be possible to fetch from the Value but for the last year. You don’t need to store it as extra column. You can use DAX SamePeriodLastYear function to get that value.
Cheers
Reza
Thank you for the article.
You have a typo in a graphic just above “Combining is Not Always Possible”
Hihgh maintenance
Awesome
thanks Nigel. great catch. fixed now
Cheers
Reza
How do I exactly create the dim table in practice? Do I use DAX or Power Query? If DAX which formula do I use for example? If Power Query, how do I do this?
Regards,
There are pros and cons of each method.
If you use the Power Query method, here is a post about it.
if you use the DAX method, here is a post about it.
Power Query will give you more flexibility on adding extra information such as public holidays. DAX method will give you a faster option to create it.
if you use the Power Query method, then you can even create a dataflow for that, and re-use it as many times you want in multiple Power BI datasets.
Cheers
Reza