SQL Server Reporting Services Integration with Power BI
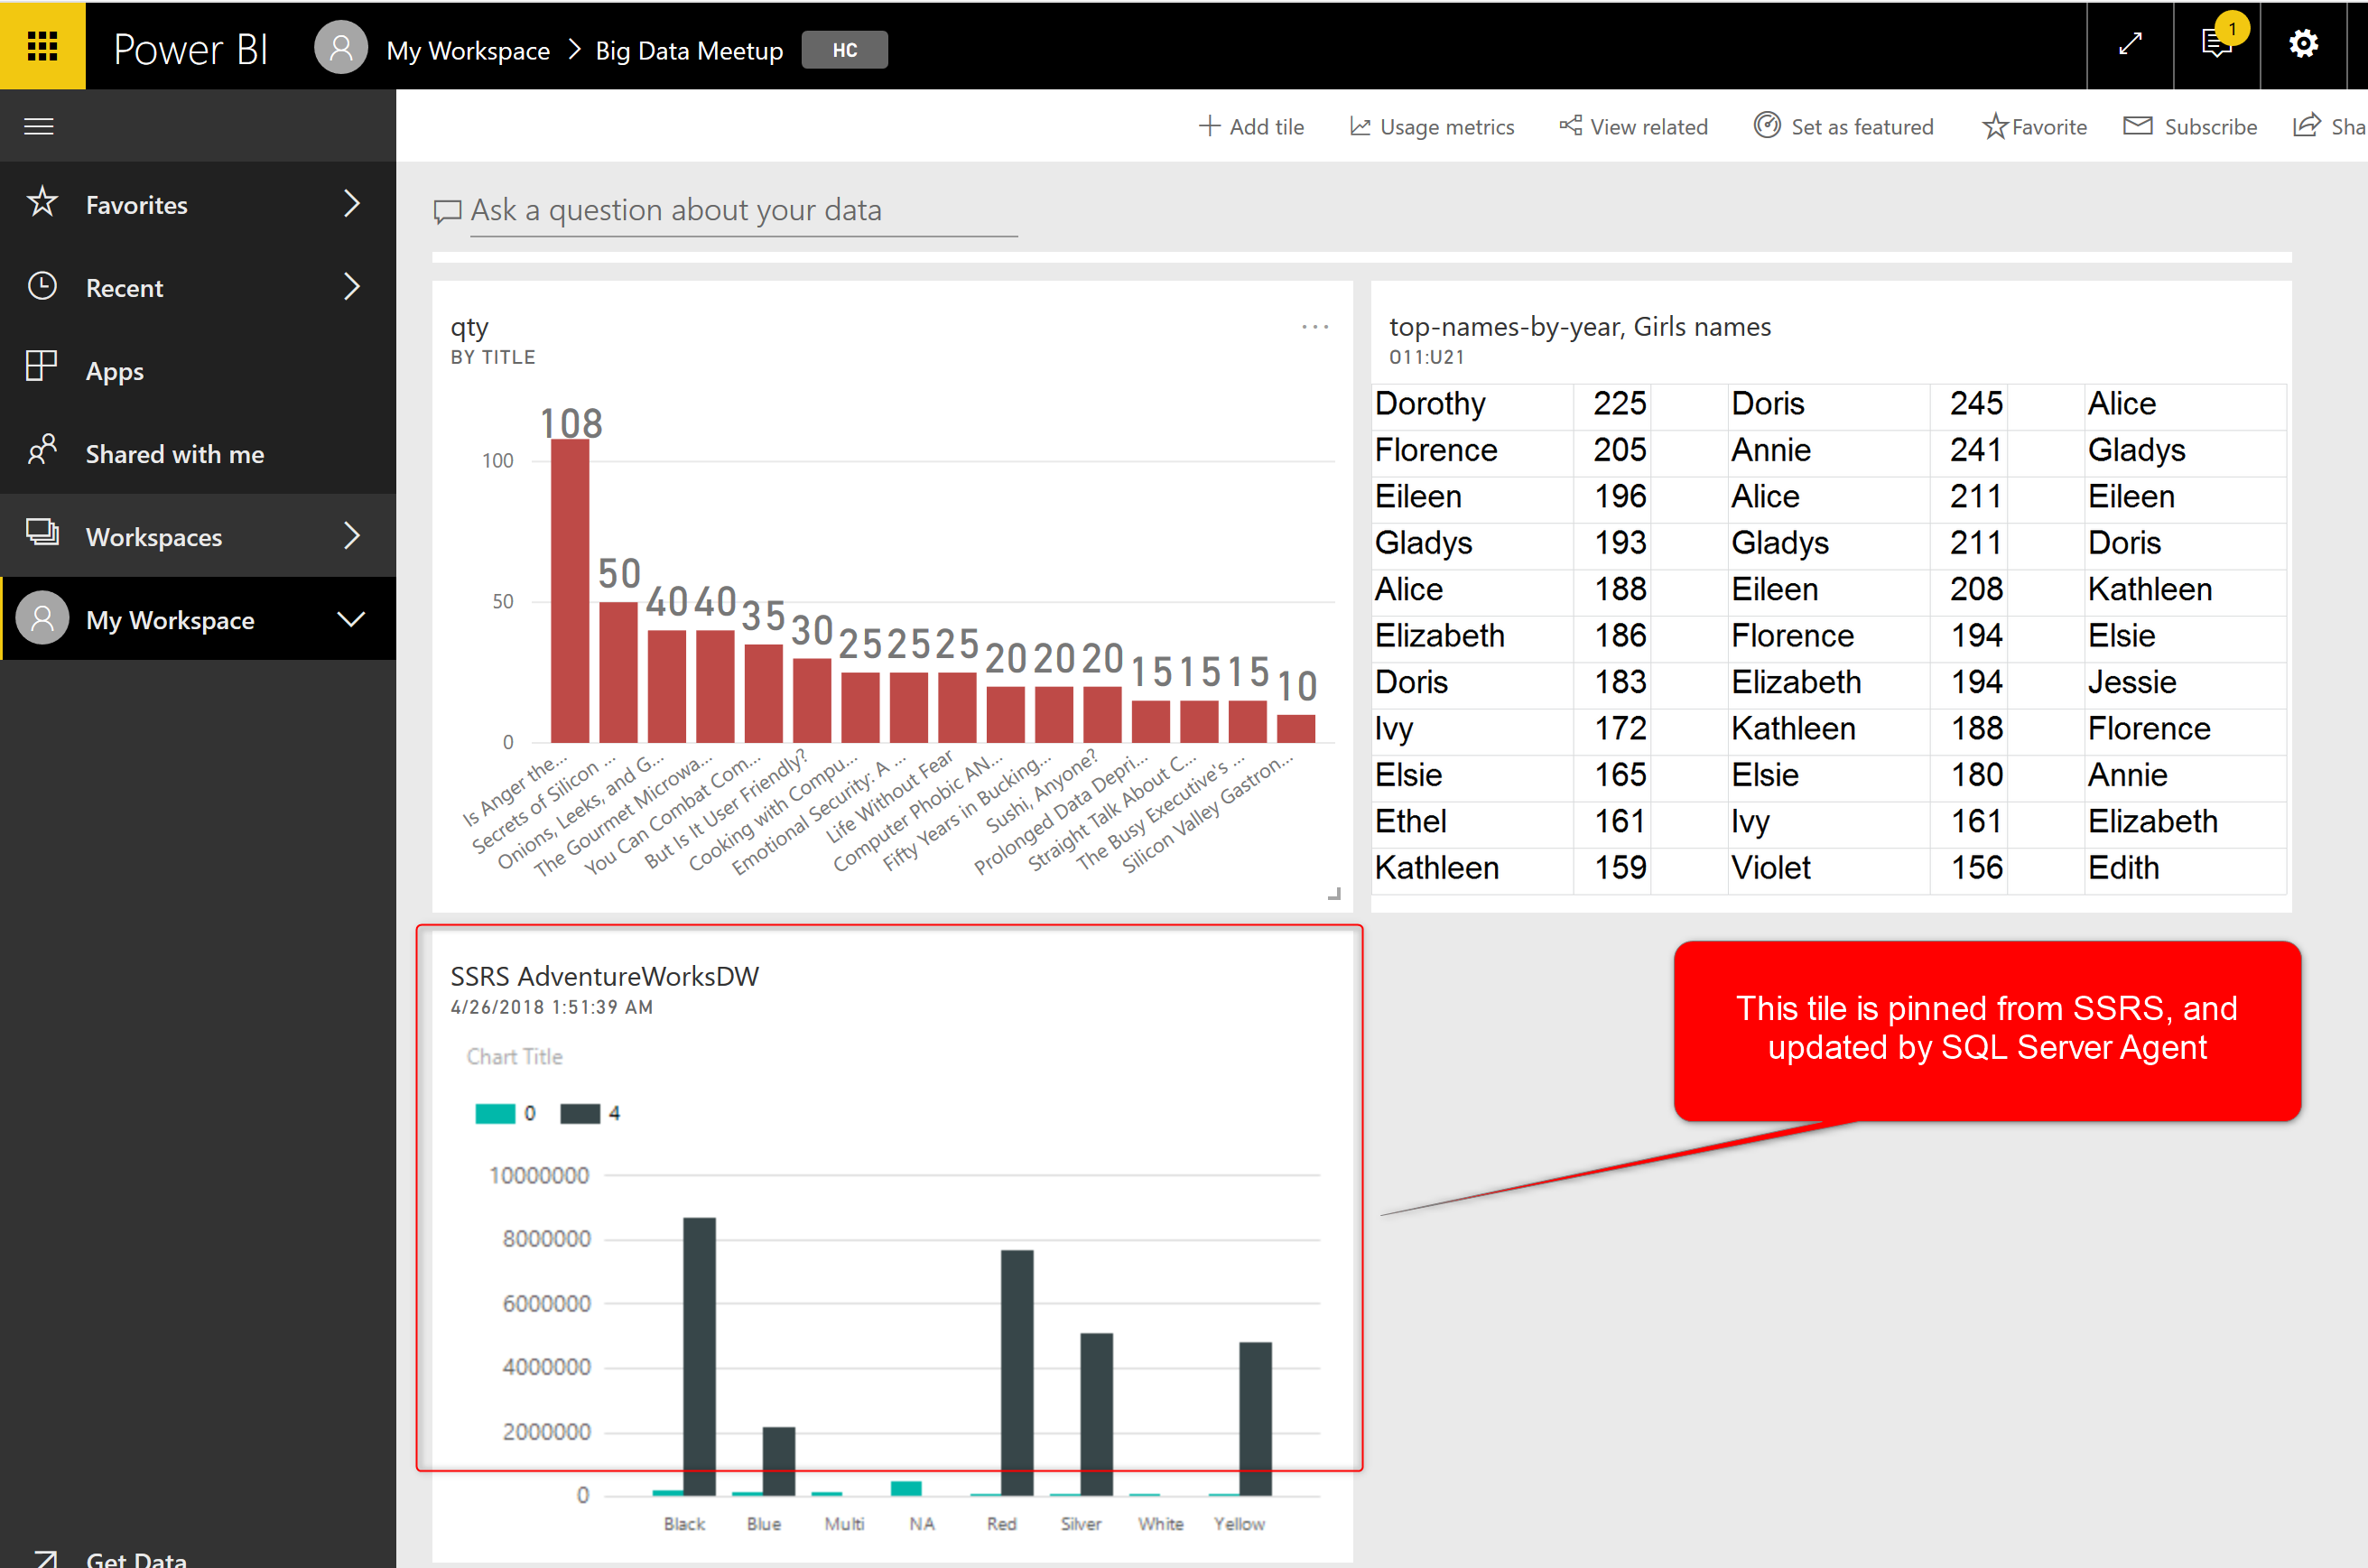
Power BI Report Server can host Power BI reports on-premises, and you’ve learned about it in the previous post. There is another integration between SQL Server Reporting Services and Power BI service; this integration brings tiles from SSRS reports pinned to a Power BI dashboard with scheduled updates from SQL Server agent. The integration of Read more about SQL Server Reporting Services Integration with Power BI[…]