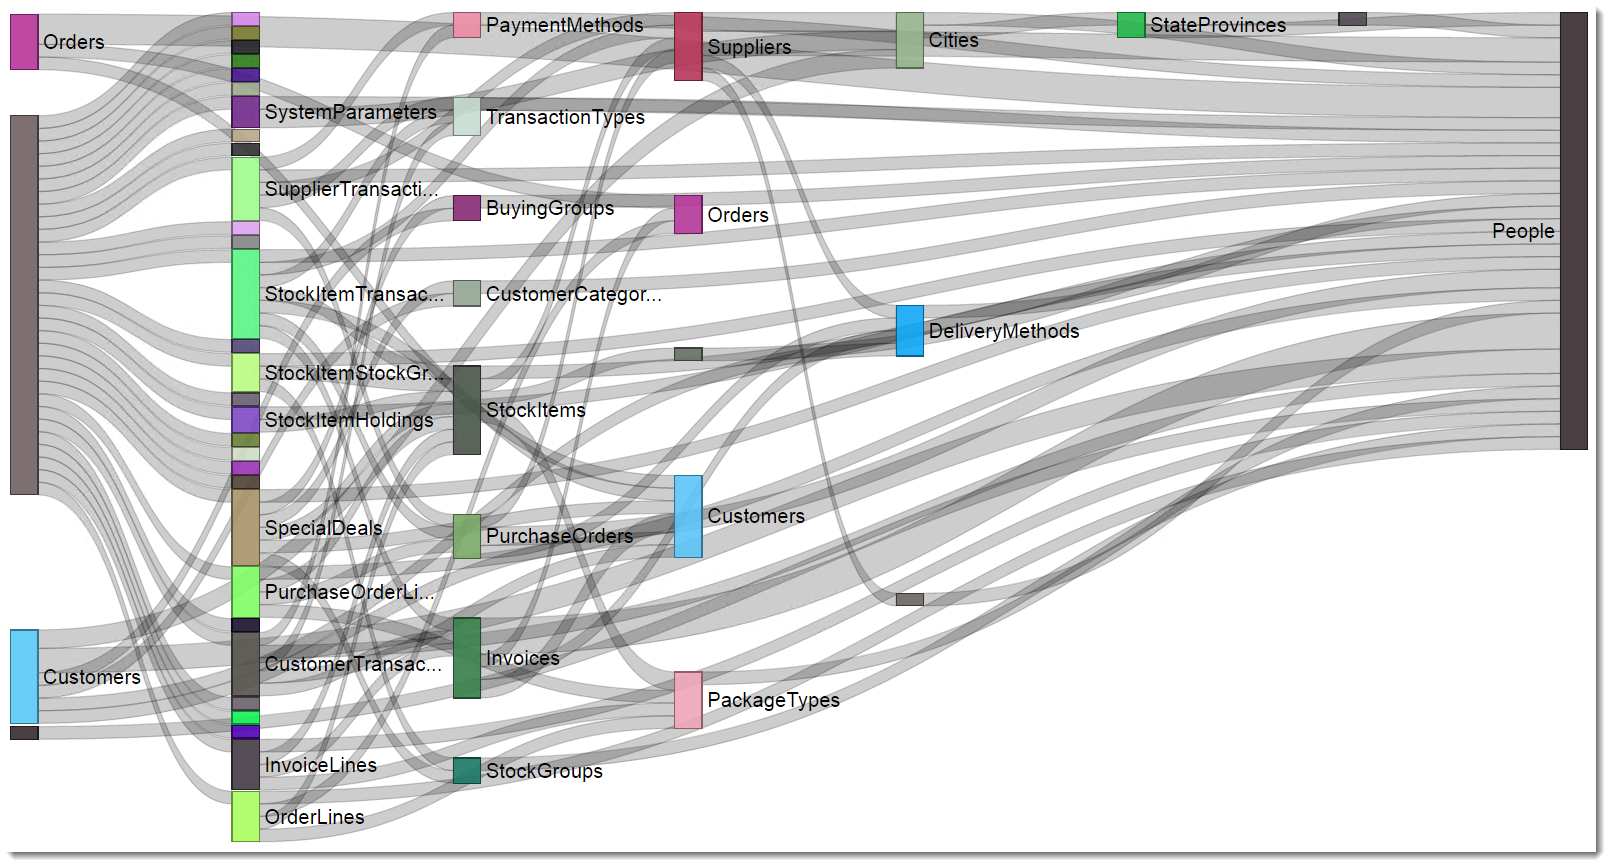
Diagram your Database Tables using Power BI
Ever wanted to create a diagram of your MS SQL Database tables in Power BI? Here is what I did to make that happen. The approach is to build a query that can be run against the catalog system views inside each MS SQL database. The approach is to build a list of “From” and Read more about Diagram your Database Tables using Power BI[…]