SlopChart RViz: Power BI Custom Visual
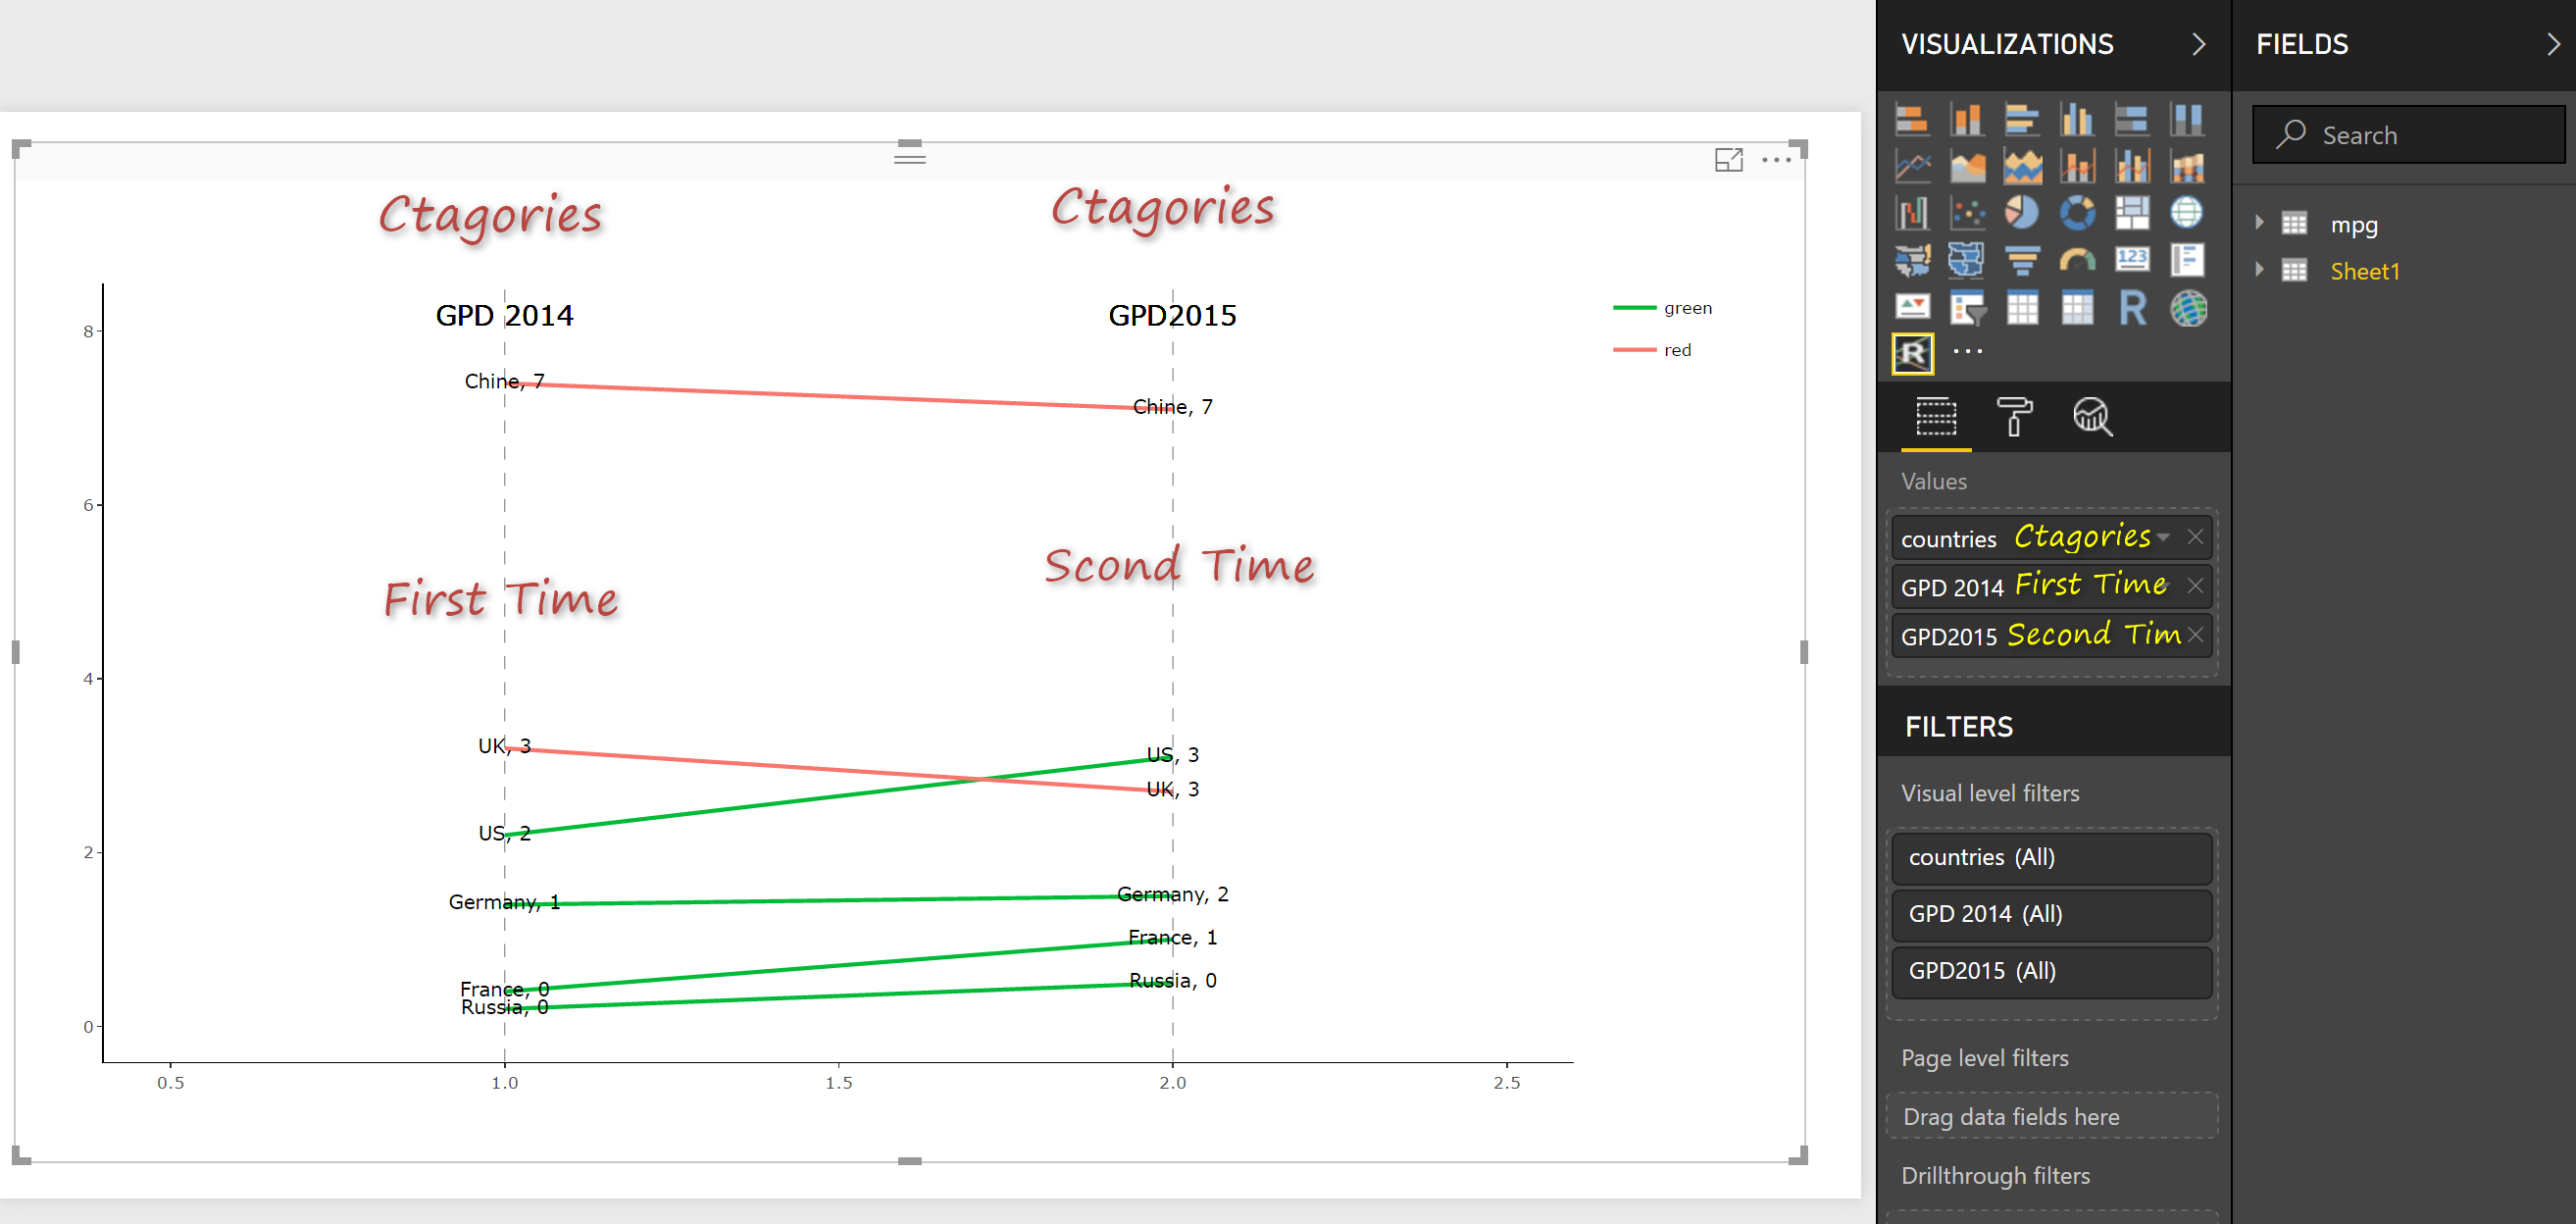
SlopChartRViz SlopChartViz is a custom visual for showing the trend between two times. There is a possibility to zoom in an zoom out in this chart. This custom visual needs: 1- First Variable: a group (categorical variable) 2- Second Variable: Value related to first time 3- Third Variable: Value related to the second time To Read more about SlopChart RViz: Power BI Custom Visual[…]