

When you have multiple items overlapping, you often need the feature to bring one forward or move it backward. In Power BI, this feature isn’t available by right-click. Instead, there is a Selection pane where you can easily set the order of elements. The selection pane also has other benefits. In this article and video, you will learn how to use the Selection pane to build the right order for your visuals.
Video
Default order of elements: As you add them to the page
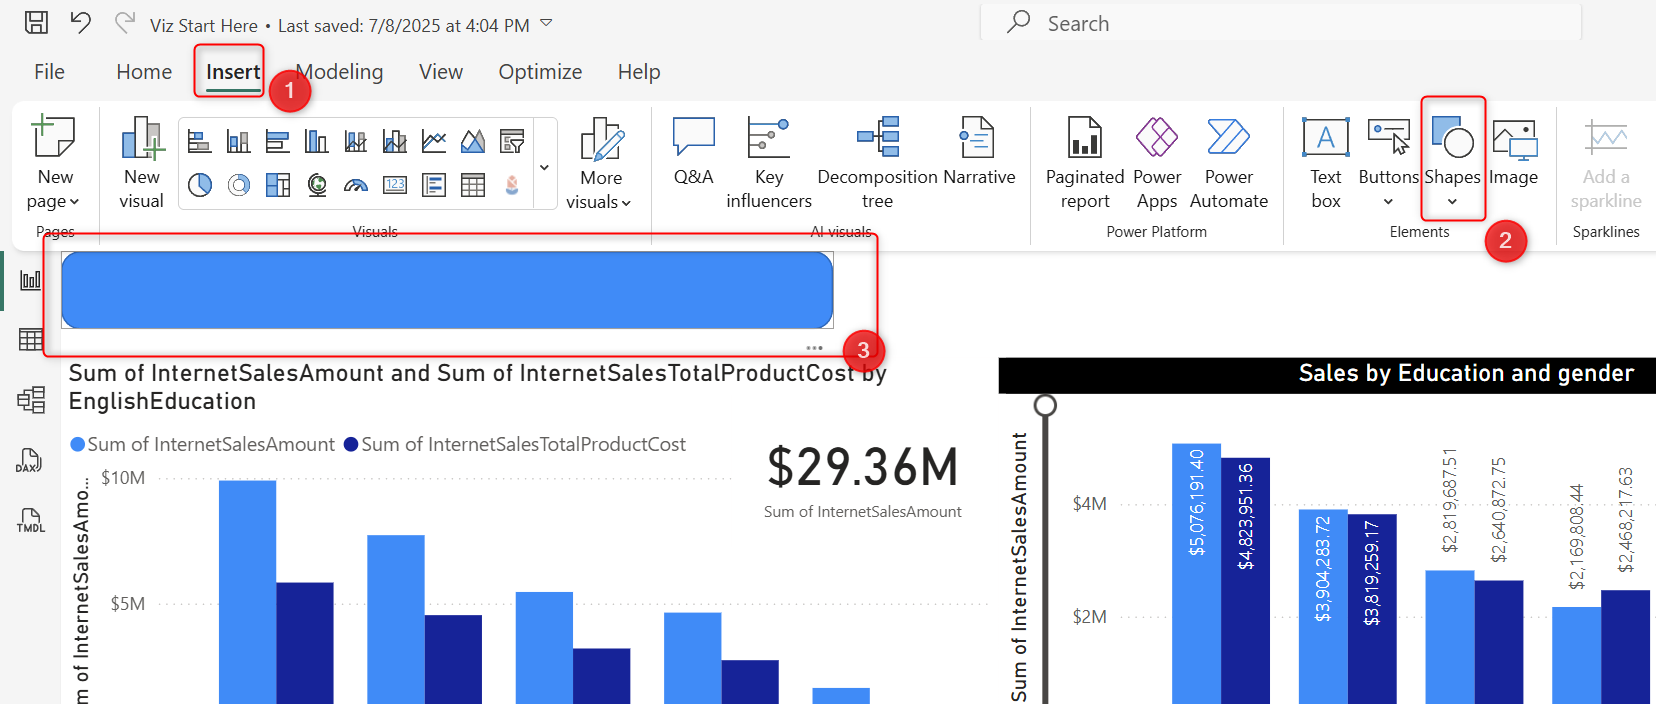
The default order of elements is as you add them to the page. For example, in the page below, I added the Shape first;
Then I add a Text box;
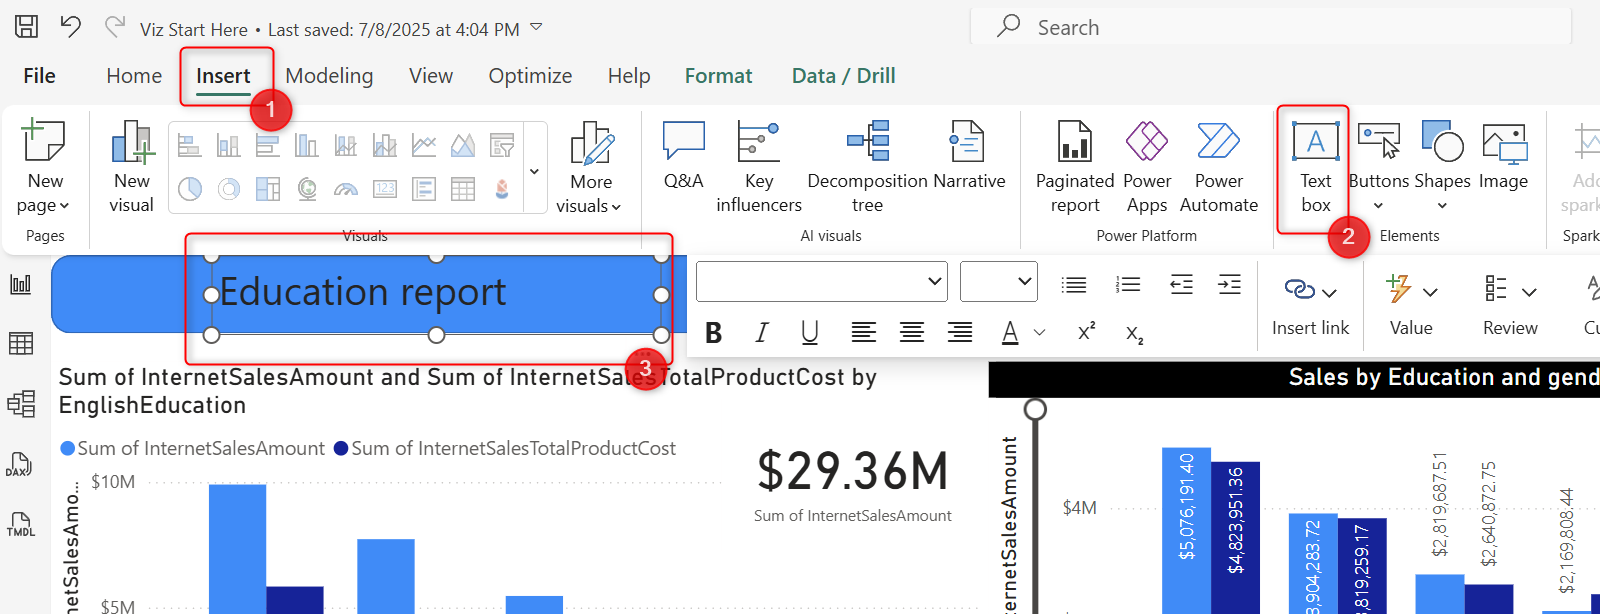
As you can see, the Text box is added in front of the Shape, which is the way I want it. because the Text box is added AFTER adding the Shape.
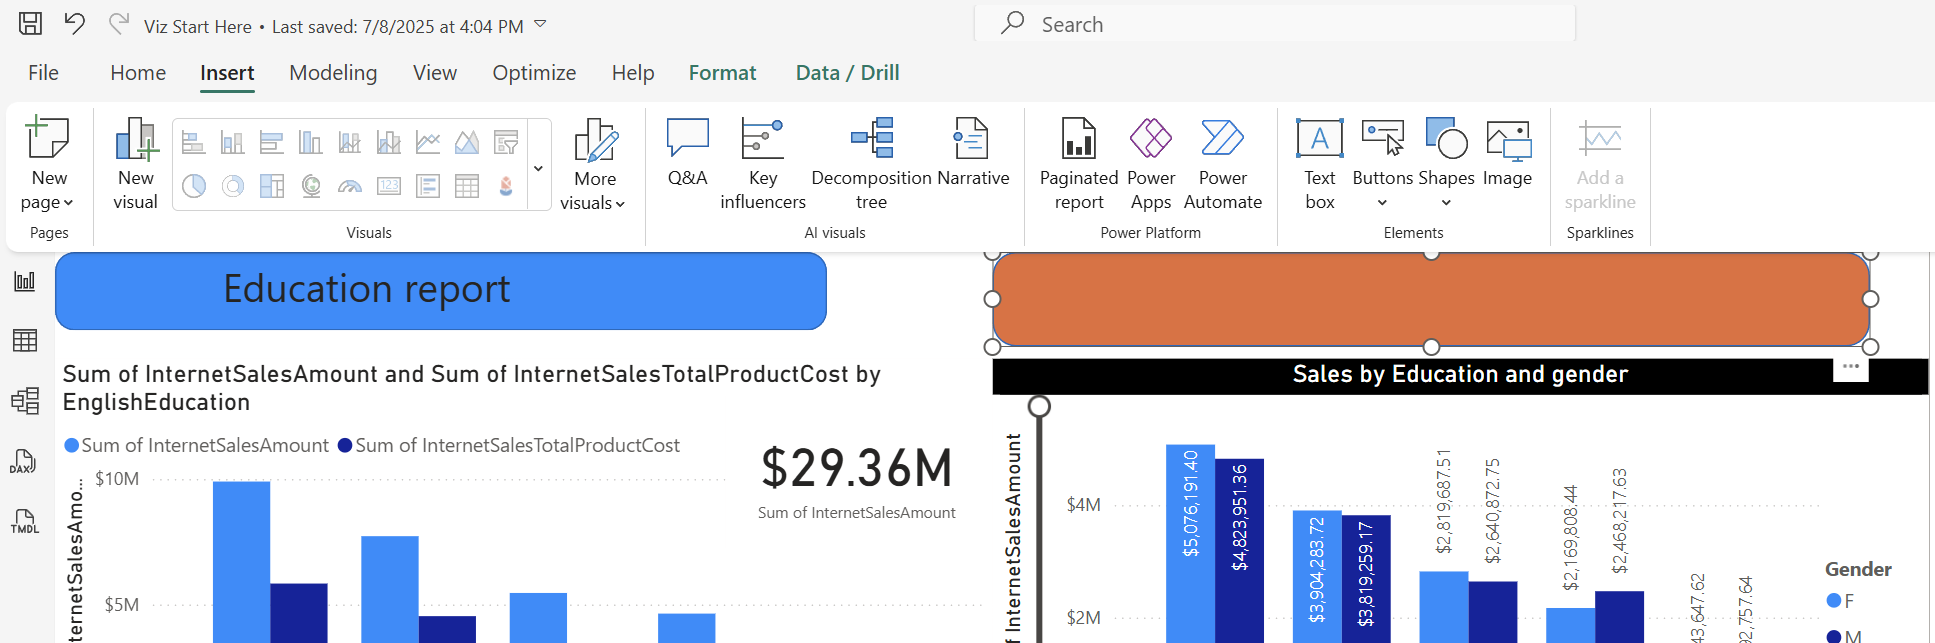
Now, if I add another Shape element;
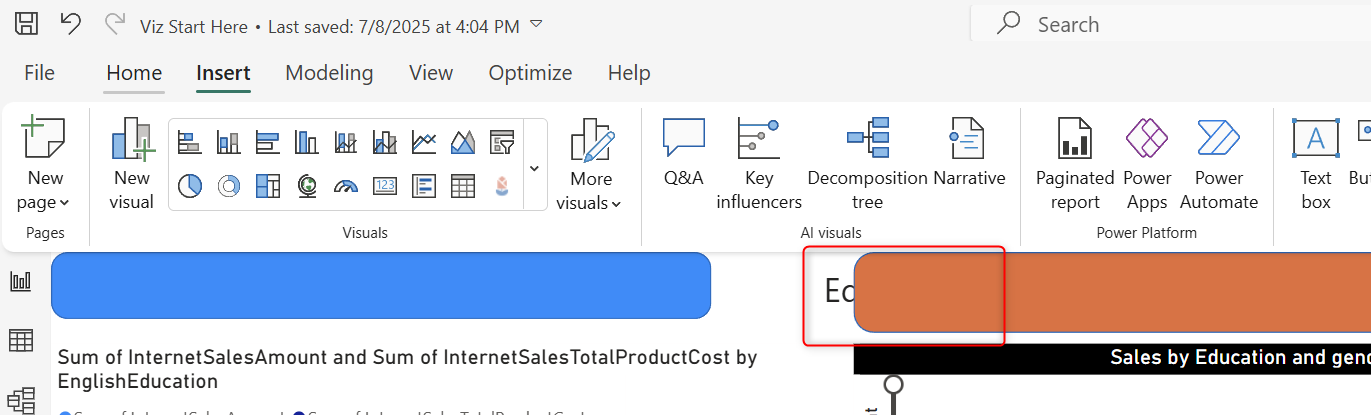
This time, if I move the Text on top of the new Shape, it will not show on top; it will be in the back, though.
Selection Pane: The right ORDER of layers
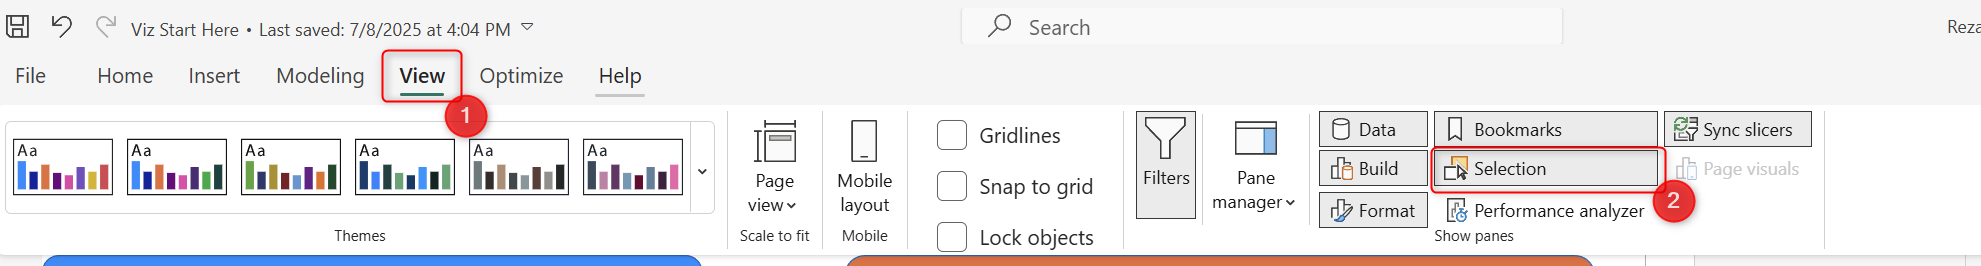
To set the right order of elements, open the Selection Pane from the View Tab.
This will open the selection pane as shown below
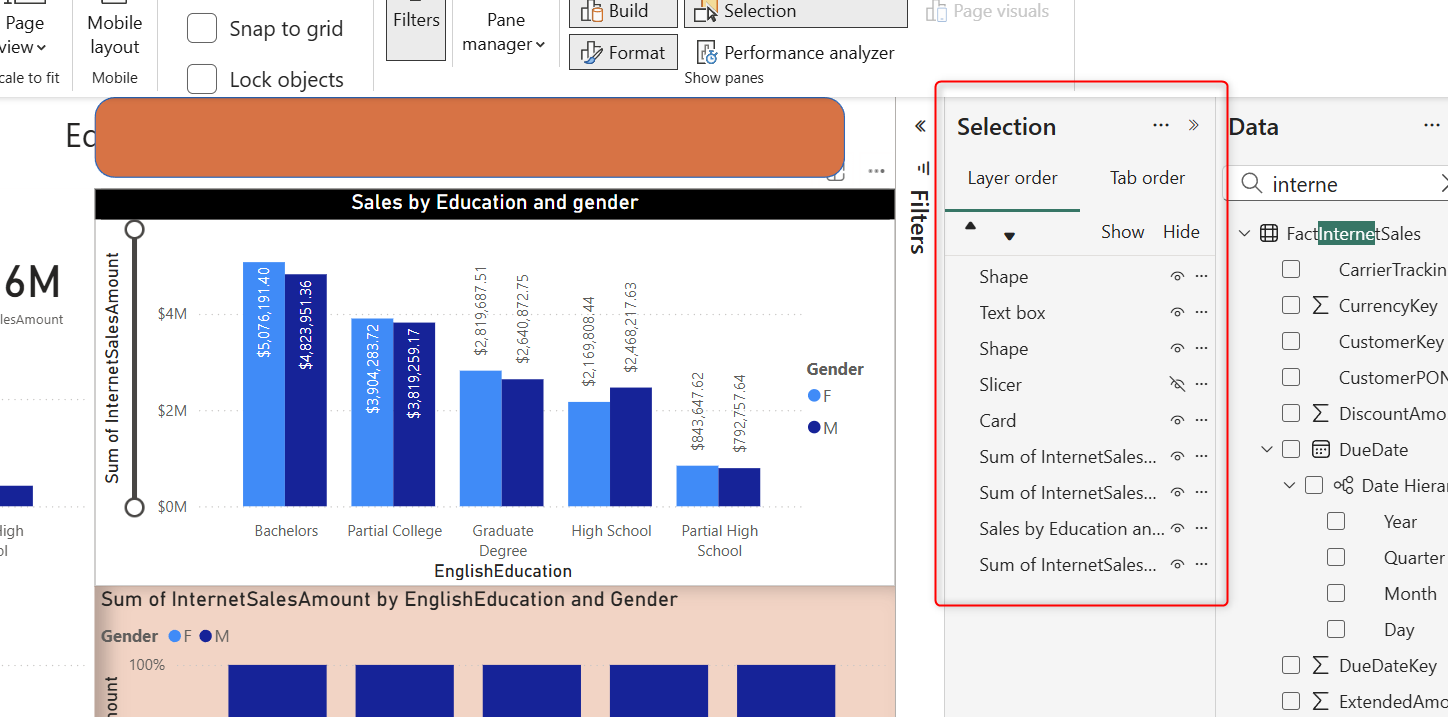
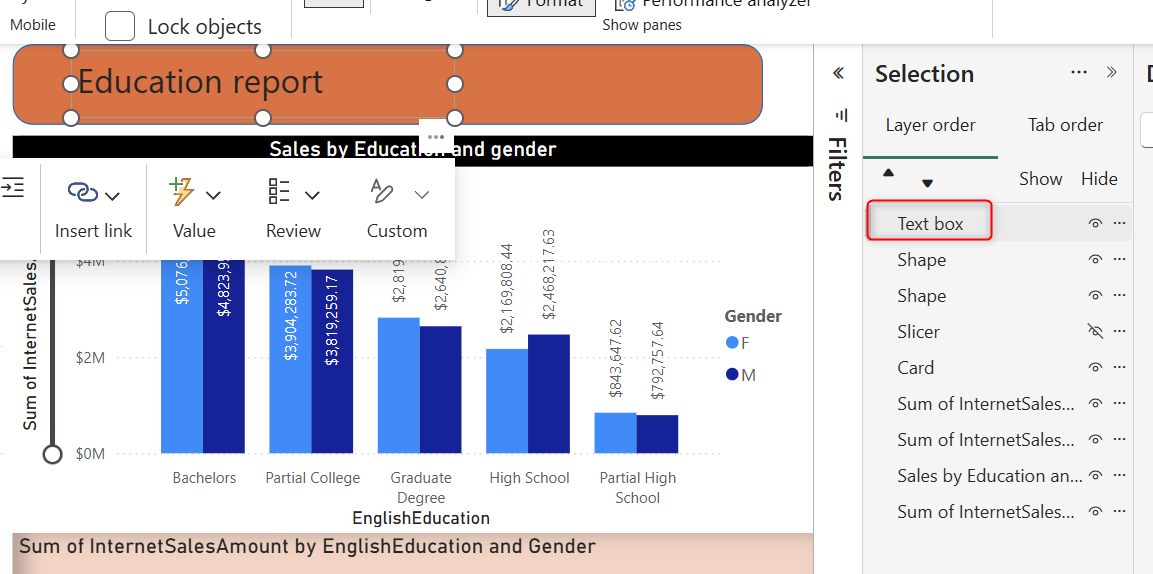
In the Selection Pane, you see a list of all elements on the page, charts, text boxes, shapes, images, and you can order them as you want. The item that is at the top appears first. If I change the order and bring the Text box to the top, you can see that it appears correctly in my report on top of the shape element.
That is how simple it is to change the order of visuals and elements.
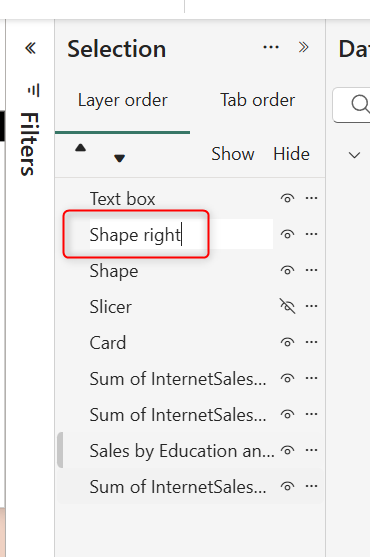
A good practice to use the Selection Pane is to have a proper name for every visual item. You can double-click on each and rename them. This way, you can find them more easily in the future. Although clicking on each item shows in the report which item it is.
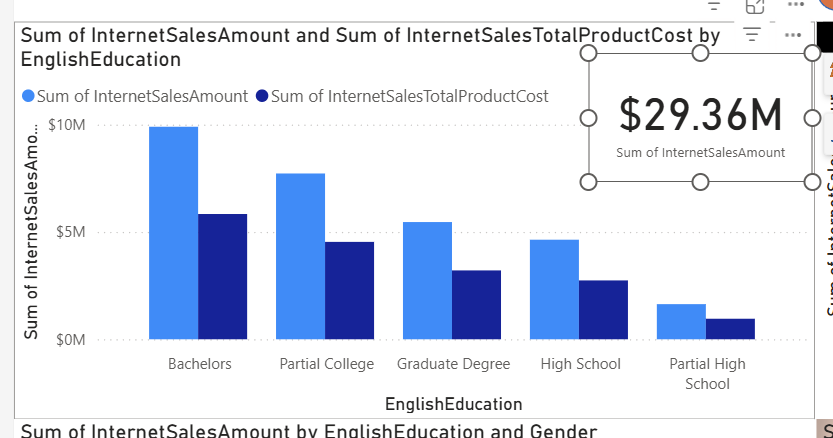
The order can also be useful when you lay charts and visuals over each other, for example, the card visual here is ordered on top of the column chart.
Hide Visuals in Selection Pane
Hiding visuals will hide them in the report, which kind of defeats the purpose of the visual in the report.
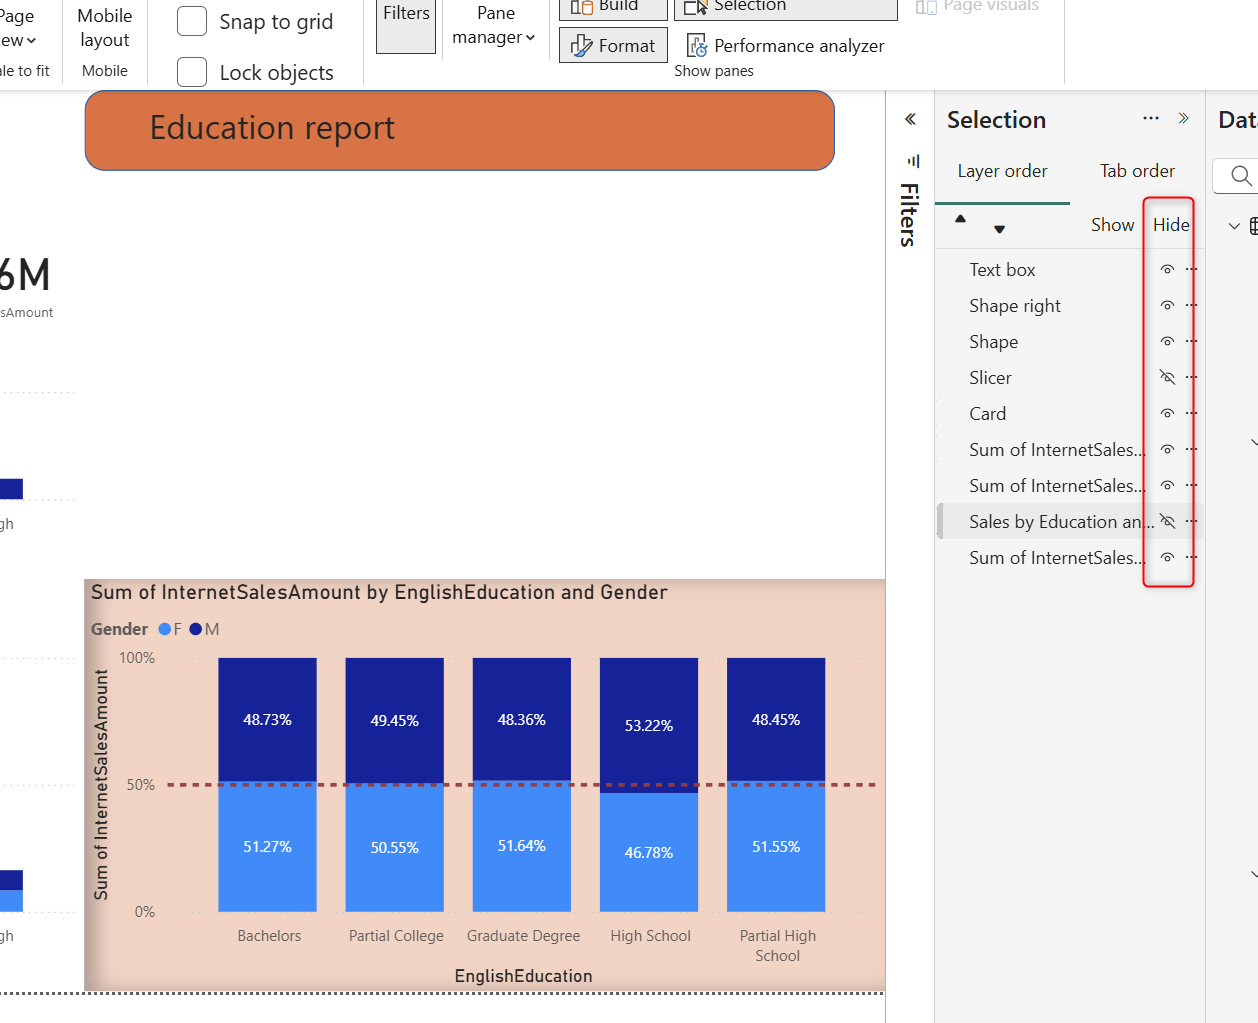
The main point of hiding visuals in the Selection Pane is the ability to combine it with Bookmarks and Buttons to create a dynamic visualization in Power BI. This is a super strong capability, which I explained in another article here.
Summary
In this article, you learned how you can change the order of elements in a Power BI report and bring them forward, bring to front, send them backward, or send to back. The Selection Pane is also very useful when combined with bookmarks.


Reza is author of more than 14 books on Microsoft Business Intelligence, most of these books are published under Power BI category. Among these are books such as Power BI DAX Simplified, Pro Power BI Architecture, Power BI from Rookie to Rock Star, Power Query books series, Row-Level Security in Power BI and etc.
He is an International Speaker in Microsoft Ignite, Microsoft Business Applications Summit, Data Insight Summit, PASS Summit, SQL Saturday and SQL user groups. And He is a Microsoft Certified Trainer.
Reza’s passion is to help you find the best data solution, he is Data enthusiast.
His articles on different aspects of technologies, especially on MS BI, can be found on his blog: https://radacad.com/blog.