
You don’t have always the luxury of having a snapshot fact table that has the stock on hand value for every single day, at every single workshop, and for every single product. Even if you want to build such a table, it can get easily gigantic. In this blog post, I am going to show you how you can use DAX running total calculation to get stock on hand without having the snapshot table in a Power BI inventory model.
Sample dataset
The sample dataset for this example is just one single table (for simplicity, I removed the product, warehouse, and any other tables), which is inventory movement:
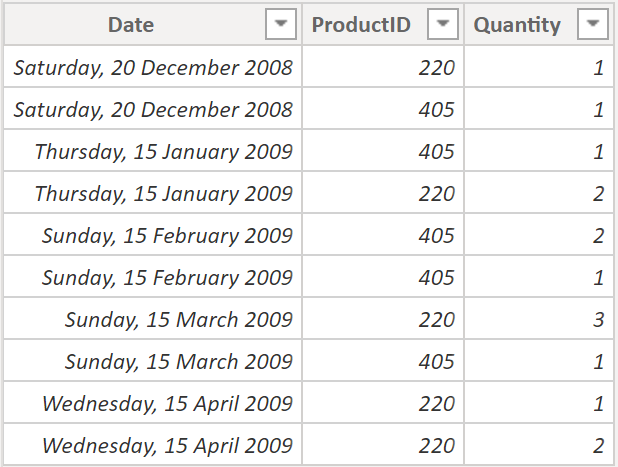
The table above shows how many products each day have been added to the warehouse. in this example, we have only one warehouse.
Desired Output
In an inventory analysis, it is important to know how many products we have at each warehouse at any given day, something like this is the desired output:
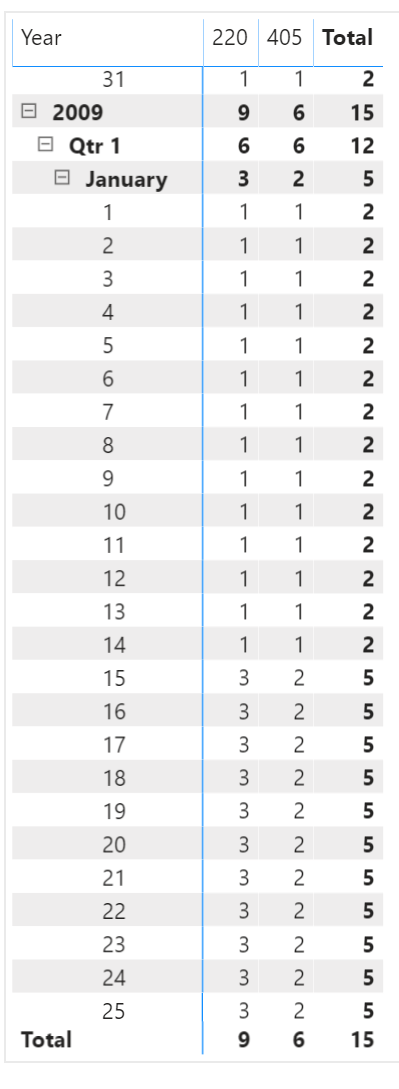
The presentation can be different, however, the fact that it should give us the running total value of the quantity in any given period remains the same.
Why not snapshot fact table?
The snapshot fact table is a type of fact table that stores values in a snapshot way. One value in any given period, and the combination of other dimension attributes. a snapshot fact table can look like this in our example:
In our case, the snapshot period is each day, and even if there is no transaction on that day, the snapshot fact table still needs to have a record for that day. At any date, all products should be listed, so that means one record per day and per product, you can also imagine that if there are multiple warehouses, then it would be one per day, per product, and per the warehouse.
This table can get really big very quickly. If we have 1000 products, and 10 warehouses, for a period of 10 years, this table would be:
(10*365)*10*1000=36.5 Million rows!
Snapshot fact tables should have one row per combination of the period, and other dimension attributes. Snapshot fact tables can get very big very quickly.
For more products, more warehouses, or more periods, you can imagine how big this table can be. Power BI, of course, can handle a table that big, and much bigger than that. However, creating such a big table just for calculating the stock on hand is not the best way of doing it. There is a much better way.
Running total in DAX
You can easily calculate running total in DAX using an expression like below:
Quantity running total in Date =
CALCULATE(
	SUM('Inventory'[Quantity]),
	FILTER(
		ALLSELECTED('Inventory'[Date].[Date]),
		ISONORAFTER('Inventory'[Date].[Date], MAX('Inventory'[Date]), DESC)
	)
)
You can even create it using Quick Measures, which gives you something similar to the expression above. If you use the default date table, however, you would need to use a “.[Date]” at the end of your date fields like what I did in the above expression.
Here is a sample result of the running total for our scenario:
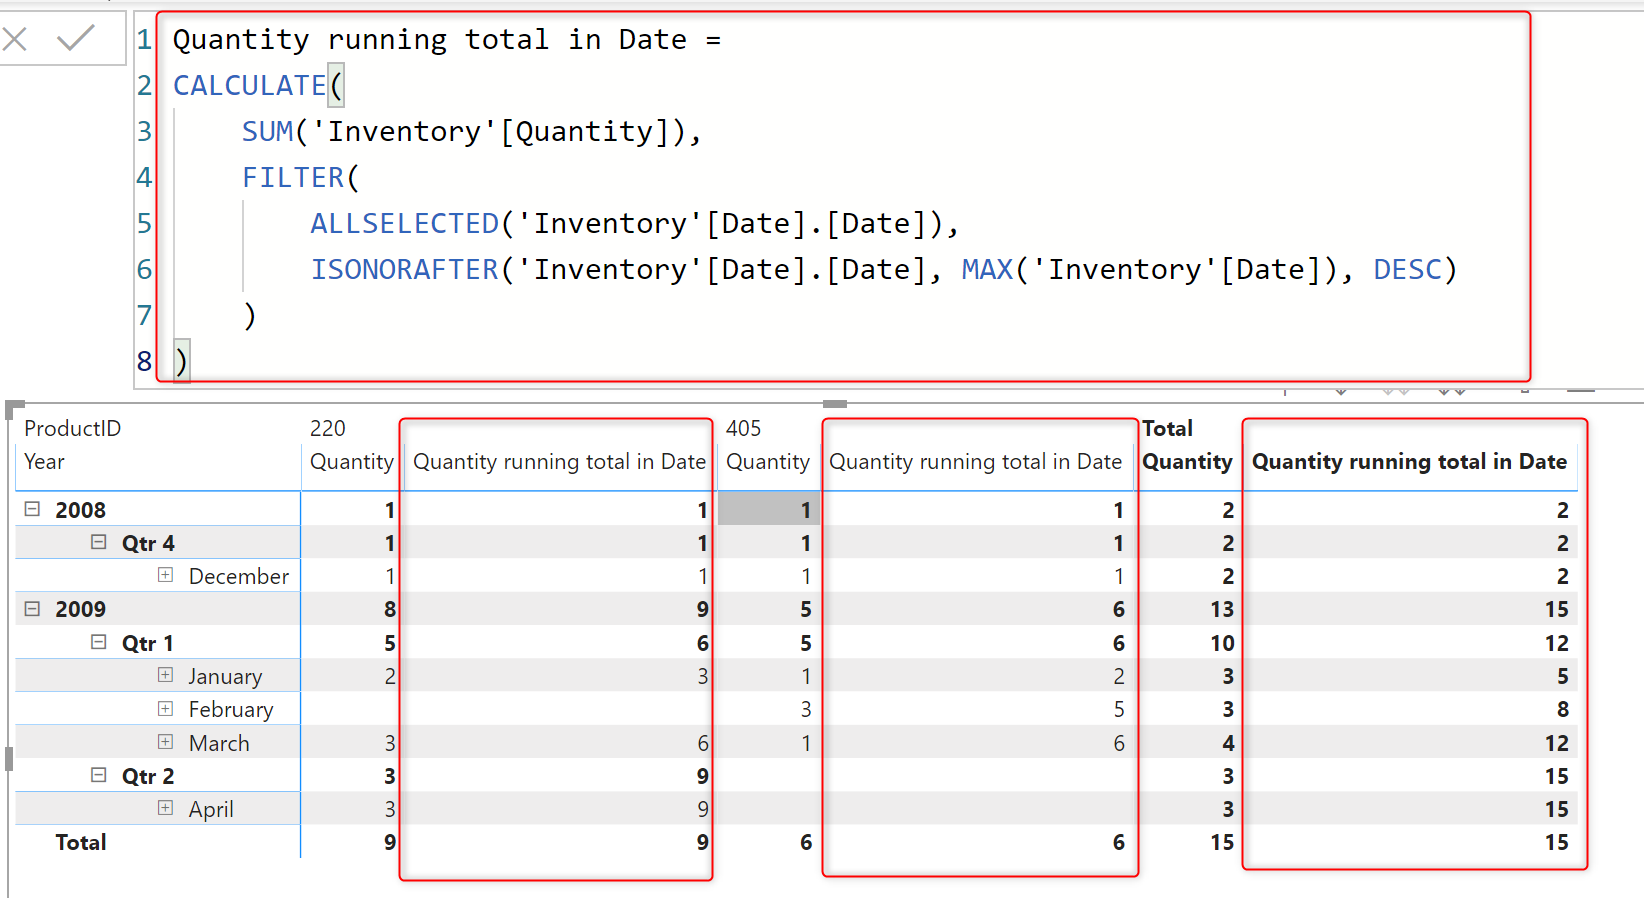
As you can see, the running total works perfectly and gives us the accumulated quantity for that given date. There are multiple ways of calculating the running total. What you see here is only one of the methods that use AllSelected and IsOnOrAfter functions in DAX for the calculation.
However, this calculation is not the final result, because if there is a date without any transaction, there won’t be any running total calculation for that date.
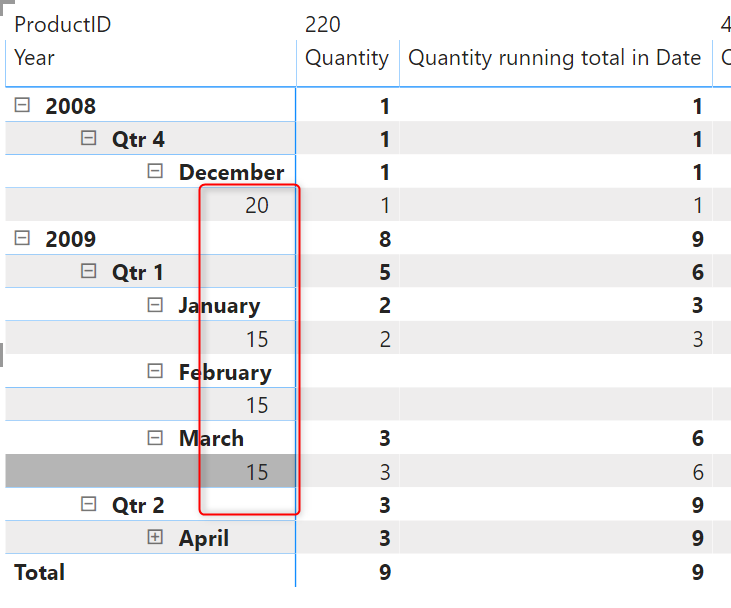
As you can see, many of the dates are missing in the above screenshot. What if we want to see what is the stock on hand for the 21st of December? or 22nd? The current running total calculation is missing those dates and doesn’t give us the right result for that reason.
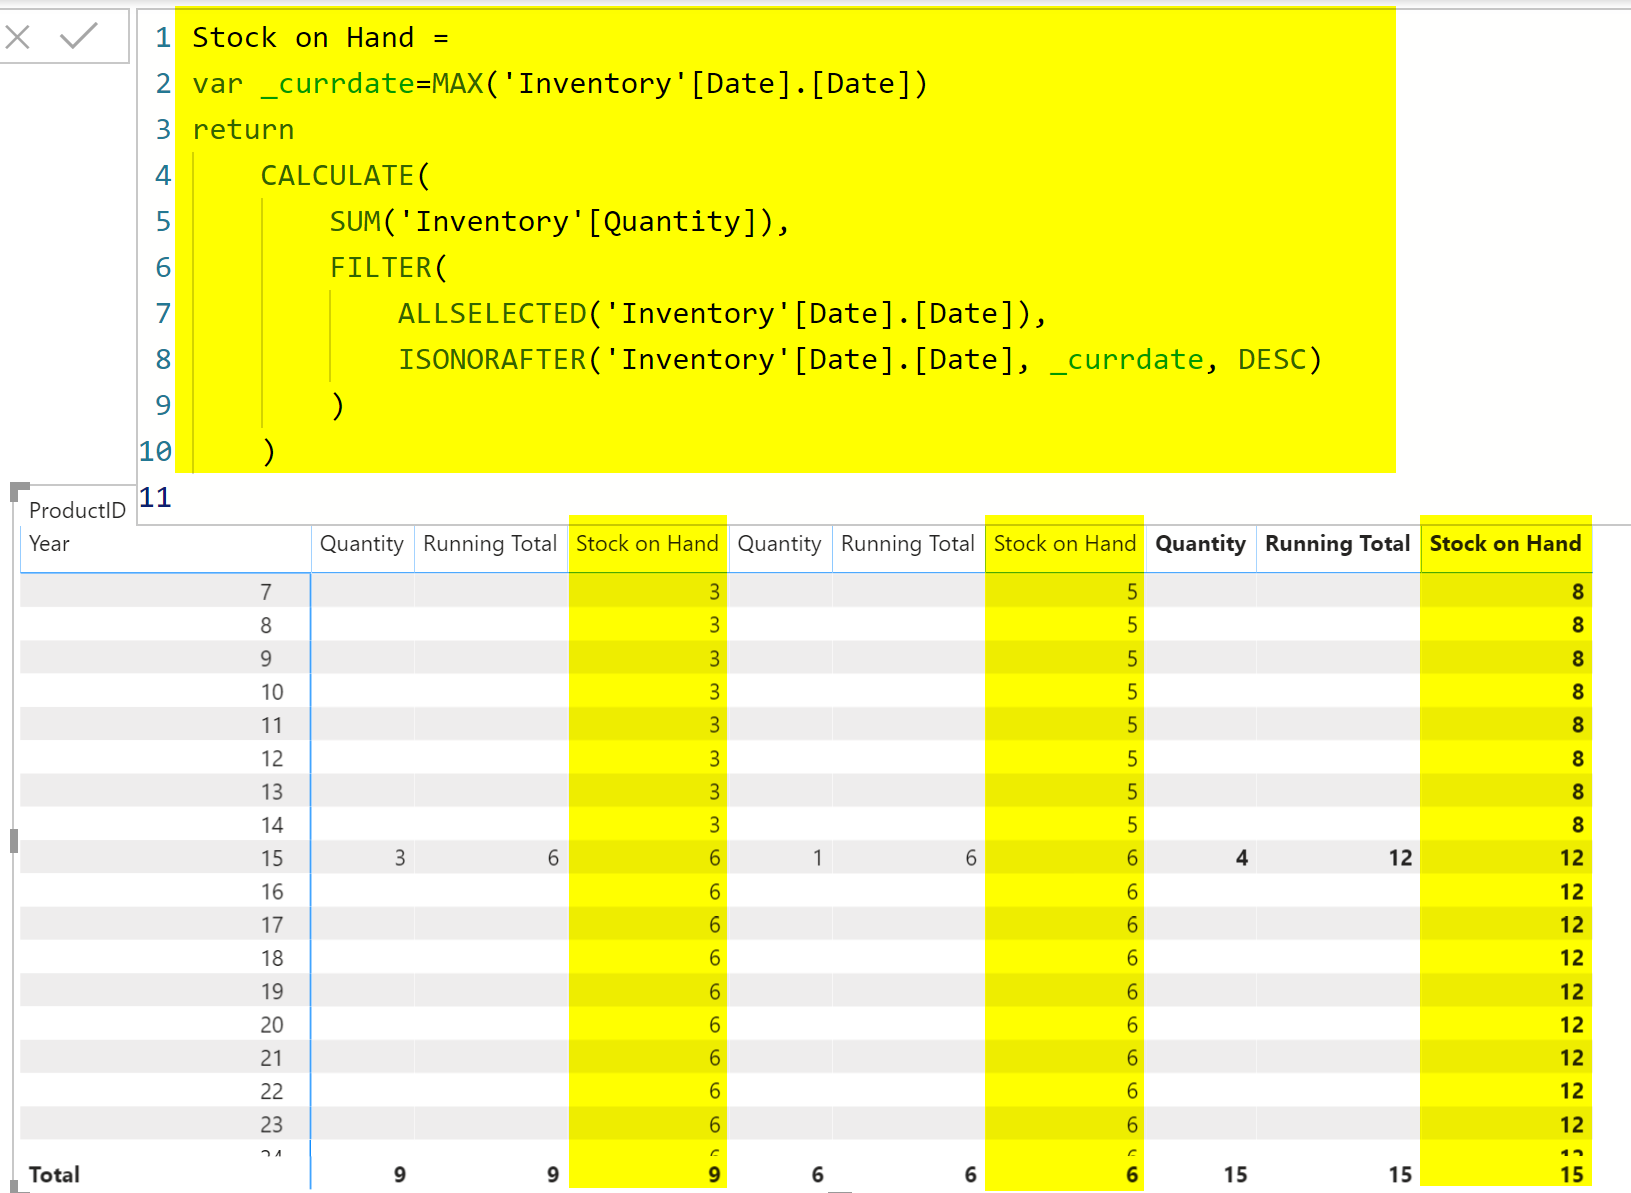
Calculating Stock On Hand
With a few changes in the expression above, we can calculate the running total value for the last date that has any transaction, and then show that result in any given period. Here is a tailored version of that expression:
Stock on Hand =
var _currdate=MAX('Inventory'[Date].[Date])
return
    CALCULATE(
        SUM('Inventory'[Quantity]),
        FILTER(
            ALLSELECTED('Inventory'[Date].[Date]),
            ISONORAFTER('Inventory'[Date].[Date], _currdate, DESC)
        )
    )
If you notice, this time I used a variable, which helps with the pre-calculating part of the expression. In this case, I use the current date (the given date in the visual), and use that for calculating the running total, and here is the result;
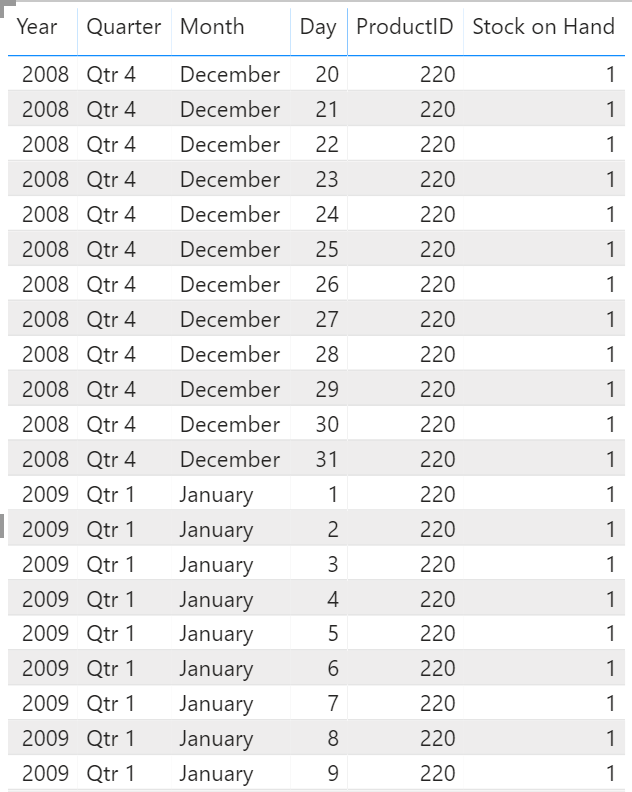
As you can see the table visual has all the dates, and there is no date missing. Even if there is no transaction for that given date, we still get the stock on hand calculation working correctly for that date.
The method used max function to get the date of the current row of the table, stored in a variable, and used it to calculate the running total. The result is the inventory on hand for that given date.
This method is working fast and reliable, and the good thing is that you don’t need a table with over 30 million rows for such a simple result.
Summary
If you already have a snapshot fact table for inventory, and pre-calculate the stock on hand using that table, then all fine, you can continue doing it that way. However, if you are thinking of creating one, I strongly suggest considering this approach. Snapshot fact tables can get very big very fast. This method works simple, reliable and yet effective in calculating stock on hand using DAX measure in Power BI.
Video


Reza is author of more than 14 books on Microsoft Business Intelligence, most of these books are published under Power BI category. Among these are books such as Power BI DAX Simplified, Pro Power BI Architecture, Power BI from Rookie to Rock Star, Power Query books series, Row-Level Security in Power BI and etc.
He is an International Speaker in Microsoft Ignite, Microsoft Business Applications Summit, Data Insight Summit, PASS Summit, SQL Saturday and SQL user groups. And He is a Microsoft Certified Trainer.
Reza’s passion is to help you find the best data solution, he is Data enthusiast.
His articles on different aspects of technologies, especially on MS BI, can be found on his blog: https://radacad.com/blog.
Hi Reza,
How would this different to the following DAX and what would be my short comings.
Stock on hand := Calculate(SUM(‘Inventory'[Quantity],
Filter(
ALL(‘Inventory'[Date].[Date]),
‘Inventory'[Date].[Date] <= MAX('Inventory'[Date].[Date])
)
very much the same. two different methods of calculation.
we can right this calculation in many other forms too. That is the beauty of DAX; you can write different expressions for one requirement
Cheers
Reza
Thanks Reza for your sharing.
From a DAX point of view, what’s the difference between the measure’s first and second expression? In the first expression, within the Filter iterator, I would have thought the MAX(‘Inventory'[Date]) is also the current date (given date in the visual) since there wasn’t a CALCULATE to force the context transition.
Thanks in advance.
Hi Luke
Can you please tell me exactly which parts of the code do you mean?
Cheers
Reza
How would you calculate this if you had time in a separate dimension table and needed to get an hourly inventory? I am using a formula above to get the inventory for all days up to the max but cannot get it to work when I include the time of day.
Can you please send me your sample file so I can have a look?
Cheers
Reza
Hi Reza, do you have any post calculating inventories from the stock movements?
you mean not stock on hand? what exactly you want to calculate?
Cheers
Reza