

Fact tables are the core of analysis in a data model. In the previous article, I explained what a dimension table is, and why we cannot have everything in one big table. In this article, you will learn about the fact table, and how it positioned in a data model, you will also learn how fact table and dimension table are related to each other to build a proper data model. Examples of this article are built using Power BI, however, all of these concepts can be used regardless of the technology. To learn more about Power BI, read Power BI book from Rookie to Rock Star.
Prerequisite
There is no prerequisite for this article. However, I highly recommend you to read below articles beforehand;
What is the Cardinality of the Relationship?
What is the Direction of the Relationship?
Data preparation; First and Foremost Important task
What is a Dimension table and why say No to a single big table
What is a Fact Table?
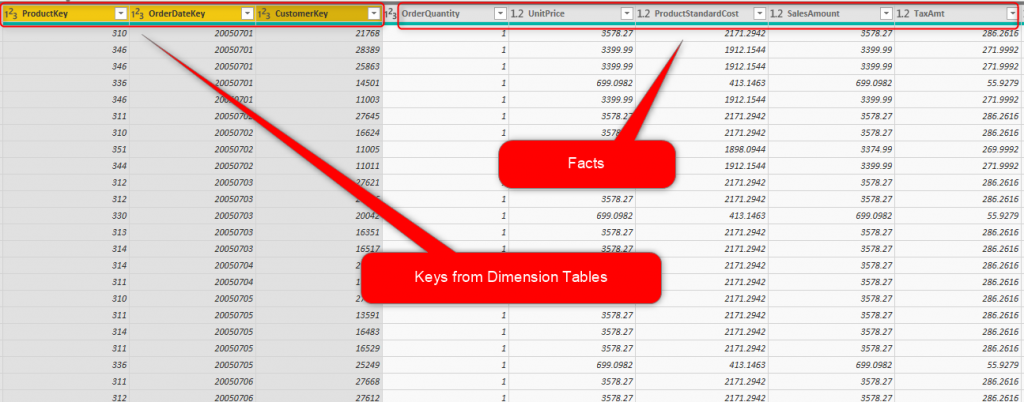
A fact table is a table full of Facts! If you have read the definition of Fact from the previous article, you know that fact is a numeric field which usually needs to be aggregated, and will be set as the value part of visualizations. Examples of Fact is Sales Amount, Order Quantity, Profit, Cost, etc. A fact table is a table full of those fields. So you may think a fact table is like the below screenshot.
![]()
The screenshot above can be a representation of a fact table based on the definition, however, it lacks something very important. The data in a fact table should be sliced and diced by the data of dimensions. For example, you should be able to see what was the Sales Amount for each product category, for each client, in each store, etc. With the structure of the table above, you cannot do that. The fact table has another set of fields too; Keys from Dimension tables.
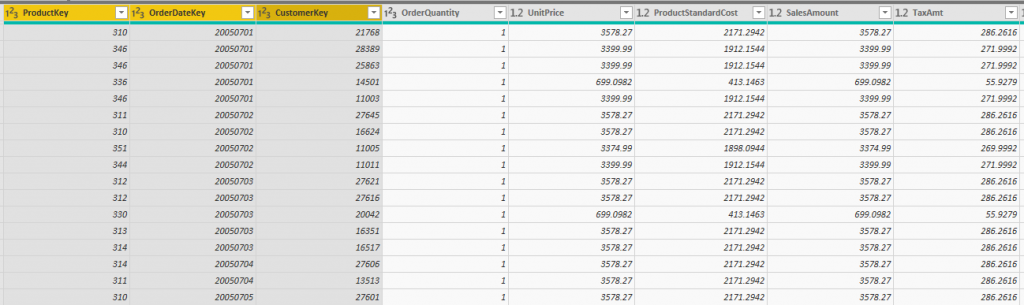
The screenshot below shows a fact table with keys from dimension tables;
As you can see in the above screenshot, A fact table includes two types of fields; Fields from Dimension tables (Keys from dimension table, Surrogate keys from dimension tables), and Facts (numeric and aggregatable fields).
A Fact table is a table in the data model which includes Facts and Keys from dimension tables.
Usually, fact tables are named based on their main entity of analysis. For example, if the table above analyzing sales data, then it can be called FactSales, or just simply Sales.
The Grain of the Fact Table
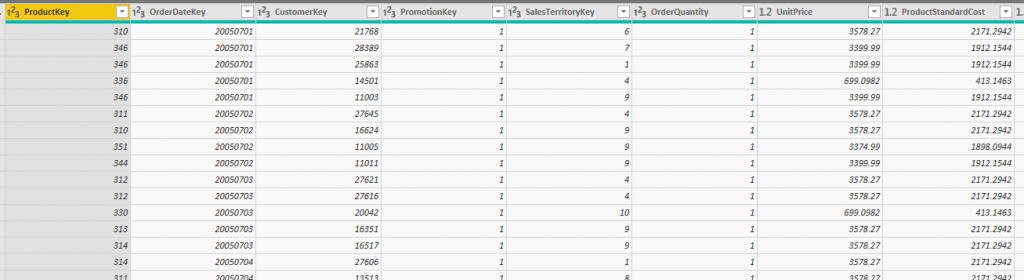
In below screenshots, I have two Sales fact tables, which are slightly different! The first one has three dimension keys of ProductKey, OrderDateKey, and CustomerKey;
The second one, has more dimension keys, it also has PromotionKey and SalesTerritoryKey;

The first fact table gives me the power to slice and dice data of sales by Product, Date or Customer dimension. However, the second fact table, in addition to those dimensions, will allow me to slice and dice by Promotion and Sales Territory too. The Grain of a fact table is the level of details stored in the fact table.
The grain for the first fact table is one record per combination of Product, Order Date, and Customer.
The grain for the second fact table is one record per combination of Product, Order Date, Customer, Promotion, and Sales Territory.
The more fields you have as a grain in your fact table means the more dimension you are connected to, and it means more power for slicing and dicing. On the other hand, more fields, also mean row numbers will increase too, and you will need more memory to store the data.
If you build your fact table from the lowest grain (the most detailed list of dimensions), you always get the ability to expand easily in the future. Although, you should keep in mind that it means your fact table will have more data rows.
Relationship Between Fact Table and Dimension Tables
Every fact table will be related to one or more dimensions in the model. These dimension tables are tables that their surrogate key (or primary key) is part of the fact table. For example, the FactInternetSales in the below data model is related to DimProduct, DimCustomer, DimDate, and DimSalesTerritory.
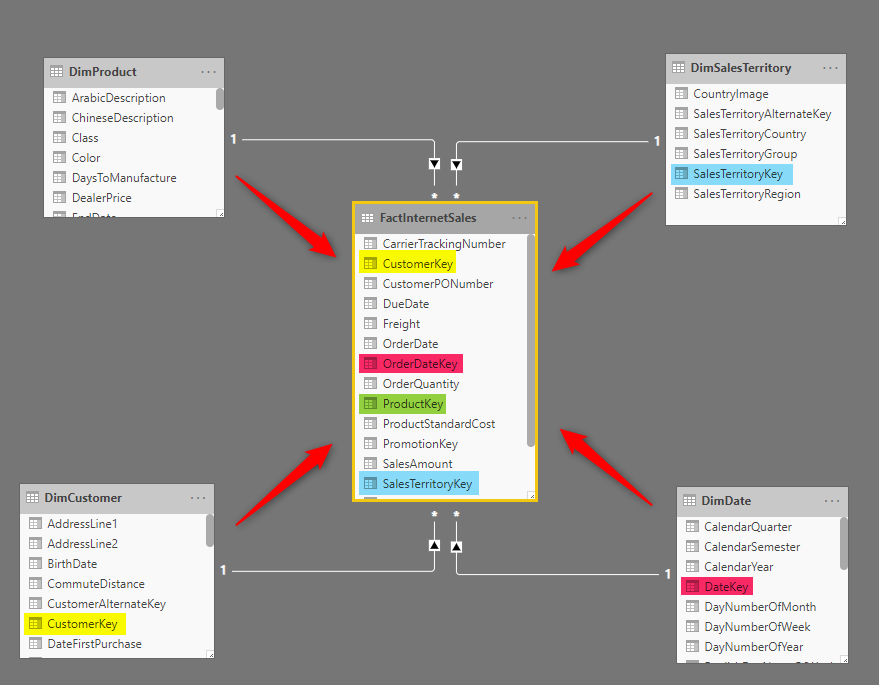
A fact table has a “many-to-one” relationship to every dimension. The direction of the relationship is from the dimension table to the fact table. In other words, every dimension can slice and dice the data of the fact table. To learn more about relationships, read this article.
Star Schema: The Golden Schema for a Data Model
The relationship between the fact table and dimension tables around it forms the shape of a Star. That is why this model is called the Star Schema. The Fact table is in the center and dimensions around it.
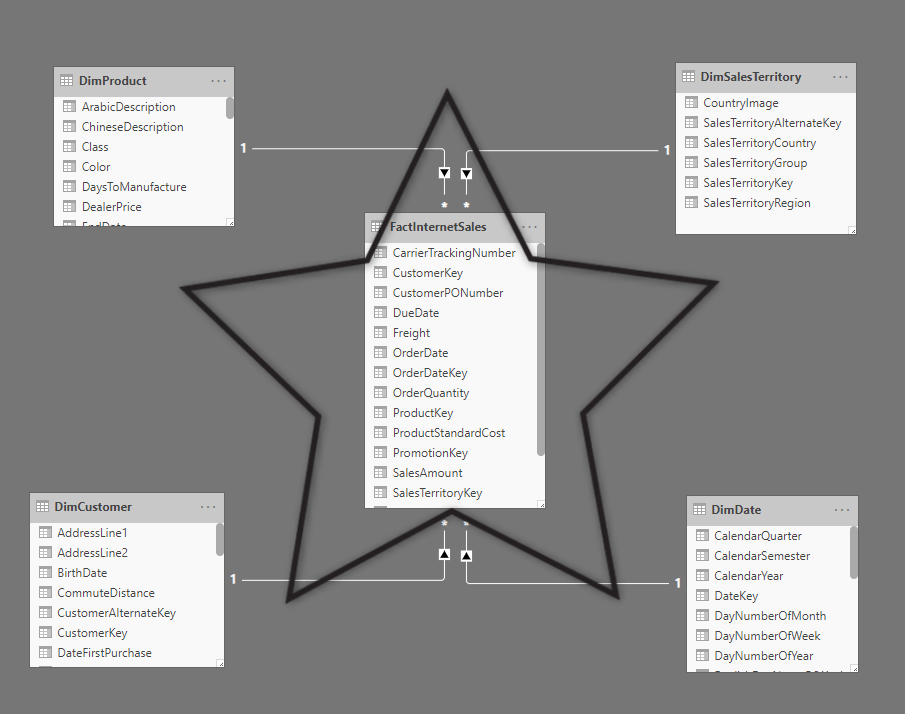
Star Schema is one of the most important concepts of a data model for reporting. Based on experience and research, the Star Schema is the best type of data model for reporting. Star Schema means that fact table and every dimension around it would have one single direct relationship. If a dimension is related to another dimension and the fact is not directly connected to the final dimension, this is not star schema anymore and is called snowflake model. The discussion of Star Schema is a big topic by itself and I write an article about it in the future. For now, this is enough to understand what is the star schema.
Different Types of Fact Table
Fact table comes in different types, although most of the time, we all use one type of it, however, in some scenarios, other types can be very helpful. Let’s check them out. Types of Fact Table I explain in this article are; Transactional, Periodic Snapshot, Accumulating Snapshot, and Factless Fact Tables.
Transactional Fact Table
This is the most common type of fact table. When a fact table is built from a transactional data table, then the outcome is a transactional fact table. In a transactional fact table, we have one row per transaction. The grain of this fact table is at the transaction level.
The grain of a transactional fact table is at the transaction level.
An example of a transactional fact table is the FactSales that you have seen in the above star schema. This table includes one transaction per row;
Periodic Snapshot Fact Table
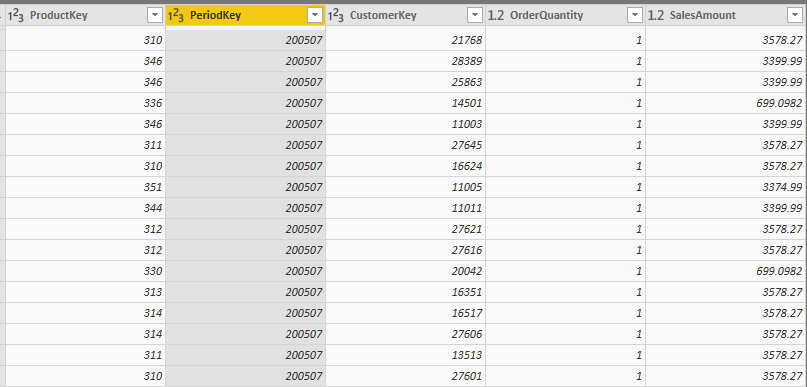
If you don’t really need all the details in the transactional table, or the amount of data is so huge that keeping the transactions doesn’t make sense, and you would, at the end of the day, only query data at aggregated level, then you can create aggregated table based on some periods (i.e. monthly, quarterly, yearly, etc). This type of fact table is called Periodic Snapshot fact table. The grain of a periodic snapshot fact table is the desired period and other dimensions.
The periodic snapshot fact table is aggregated on the desired period.
For example; in the stock exchange market. Values and rates are changing every millisecond. You may not need all those details in the data model. You may create reports on data by minutes or by hours. In that case, you can create a periodic snapshot fact table of the desired period.
Here is an example of a snapshot fact table which is aggregated in month level.
Accumulating Snapshot Fact Table
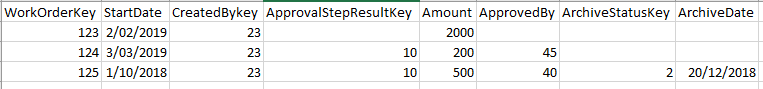
When the snapshot is created through a process. For example; for creating a work order, first, the work order request has to be raised, then it should be sent to appropriate department and manager, then the manager should approve or reject it, then depends on that action, some other steps might occur. Every row in the accumulating snapshot fact table will have details of one work order in such case.
Accumulating snapshot fact table is great for process-oriented analysis, such as workflow.
The reason that this table is called accumulating snapshot, is that part of the data coming later into the table. At the time of processing the table, we might not have the entire data for a workflow or process.
The below screenshot is an example of an accumulating snapshot fact table. As you can see, not all columns for every row is filled. Some part of the data might arrive later. There are columns showing different stages of the process.
Factless Fact Table: Bridge Table
After the transactional fact table, I can say this type of fact table is the most common type of fact table. A factless fact table is a fact table without any facts! It seems strange, however, it is like that because of an important purpose. A factless fact table is to check the NOT part of an analysis. For example, in a model like a star schema above with the sales table, how you can tell that there was a promotion for a product in a day, that no sales been made for it?
Factless Fact tables are great for analyzing NOT existence of the data.
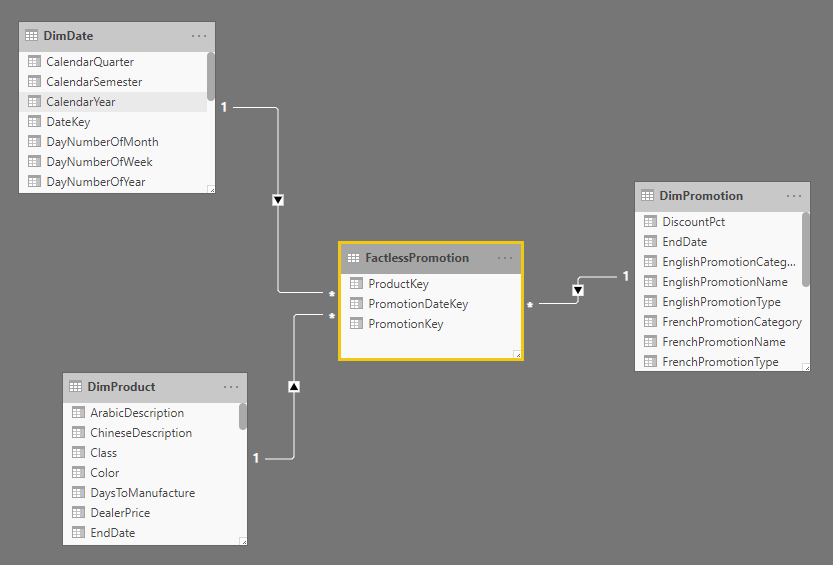
A factless fact table doesn’t have any facts in it, it just have key fields from dimensions, below is an example of a factless fact table for promotions on products on different dates;
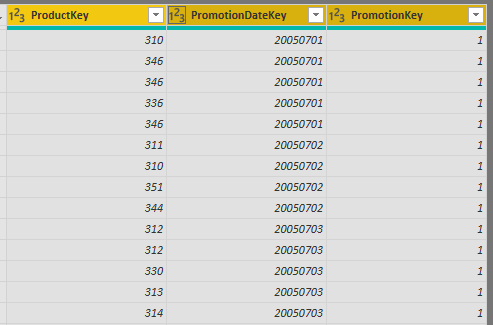
As you can see, this table doesn’t have any facts about it at all. It is just a relationship table that relates the three tables of Product, Promotion, and Date. That is why these tables are also called as Bridge Tables.
Factless fact table itself requires a full article to explain the details of it. So stay tuned for an article about it.
Summary
Fact tables are storing facts and also keys to the dimension tables around. The relationship between the fact table and dimension tables is “many-to-one” and allows dimension tables to filter the data in the fact table. The relationship between fact and dimension tables creates a star formed schema called star schema. However, there are lots of details about Star Schema which I will talk about it in the next article. You also learned that there are different types of fact table such as transactional, periodic snapshot, accumulating snapshot and factless fact table.
Do you have a table which you don’t know is it a fact table or not? ask in the questions below, I would be able to help for sure. I also recommend you to read below articles on related subjects;
What is the Cardinality of the Relationship?
What is the Direction of the Relationship?
Data preparation; First and Foremost Important task
What is a Dimension table and why say No to a single big table


Reza is author of more than 14 books on Microsoft Business Intelligence, most of these books are published under Power BI category. Among these are books such as Power BI DAX Simplified, Pro Power BI Architecture, Power BI from Rookie to Rock Star, Power Query books series, Row-Level Security in Power BI and etc.
He is an International Speaker in Microsoft Ignite, Microsoft Business Applications Summit, Data Insight Summit, PASS Summit, SQL Saturday and SQL user groups. And He is a Microsoft Certified Trainer.
Reza’s passion is to help you find the best data solution, he is Data enthusiast.
His articles on different aspects of technologies, especially on MS BI, can be found on his blog: https://radacad.com/blog.
Thanks for this great article, i learned soo much and it helped me to corroborate other courser about this topic!
Hi Reza,
Great article again, I’m looking forward to future articles in this series!
I have a question though: my Azure SQL DB receives data from a workflow in SharePoint Online, and it pertains a process in which financial risk models are drawn up, approved, commented on etc. This results in a model with a lot of many-to-many relationships and multiple facts connected to each other through one ID basically (let’s call this the Model ID).
For now I want to report on two of these facts (basically a distinct count on each of them), which are related to each other. In my opinion I would have to build two star schema’s for this (one per fact). To me they seem to be Accumulating Snapshot Fact Tables or Factless Fact Tables, or some kind of combination of the two. I have already made a bridge table containing only the unique Model ID values, connecting all the other tables with each other. Maybe some extraction of dimensions from these fact tables has to take place.
Now my question is: how to transform this strange model with all the tables in it, which are only connected through one bridge table, to multiple star schema’s and is this the way to go? Thank you in advance!
Hi Robin,
Without looking at the diagram I can barely help with the model. However, having multiple star schema in one model is absolutely fine, I explained it here.
Cheers
Reza
Does it ever make sense to use a UNION set operator to combine 2 or more fact tables together that have the same table structure, say in a view, to make them look like one fact table?
for fact tables, we don’t usually use UNION or append. If they are in the same granularity, we can use Merge/Join on them.
I understand that surrogate column can be added to Dimension table. How to get the values from surrogate column in the Fact table. Fact tables may be referencing non-surrogate column of the Fact table.
Hi,
You can use Merge in Power Query for that, merging the fact table with dimension table using the non-surrogate key, then fetching the surrogate key from the dimension table underneath, and using that for relationship
Cheers
Reza
In Power BI, after built the Factless Fact Table (Bridge Table)
How to get the sales of the Promotion in fact table?
Any example in Power BI model and relationship setting?
Hi John,
please share a screenshot of how your tables and relationships are in the diagram, so I can understand the question and help on the answer
Cheers
Reza
Hi,
I have an interesting dilemma.
My fact table is also a dimension table.
Say I have work orders placed by customers:
OrderID, OrderDate, CustomerID, DollarAmount, ProductCategory
And on these orders I have quality checks:
CheckID, OrderID, ReviewerID, Score
Both of these are fact tables right? But isn’t the OrderID a dimension of checks? Can a table be both a fact and a dimension?
Hi Brent
Can you explain more about the logic? are there multiple checks per work order? what is the action happening here that you want to store?
Cheers
Reza
Thank you Reza for always delivering detailed articles always. Your explanations are granular and explicit.
Thanks Joyce
Glad you liked it
Cheers
Reza
I am building a Star Schema. The Customer, Date, and Product dimension tables are connected to the Sales data. I am also including monthly budget numbers in this model. I am taking my sales budget to the product level. Very much like you have done with the model you are presenting.
I would also like to analyze the production of a commodity in the marketplace to the sales of various products we produce. I have quarterly commodity production numbers and have taken that to a daily granular level. I would like to look at how many products we sell based on the production of the commodity and do that over a timeframe for the data that I have available.
Would my commodity production table be a Fact table or a Dimension table? How do I connect actual product sales to commodity production?
Than you for these blog posts. This is an excellent series.
Hi Calvin
If I understand correctly, your commodity production table is like a budget table, on a different granularity, and a fact table.
if yes, have you read my post here about how you can use it?
if you still have a question, can you please explain with an example what you are after?
Cheers
Reza
Hi Radacad Team – Basic question, but if you have multiple Regions, and each region relates to multiple countries, how does this get set up in the dimension table so you don’t have many-to-many issues between the dim and the fact table?
Hi Sean
if one region can include multiple countries, then it means the region and country have one to many relationship. and you would have the region in the country dim, and the country dim connected to the fact table
Cheers
Reza