

I have written dozens of articles about row-level security so far and explained in all of them explained different methods in which you can reduce the amount of data rows that a user can see based on their roles. However, in my presentations, I still get this question that: What if I want to compare the branch data against the total, but I don’t want the user to see other branch’s data. My approach to solving that is always an aggregated table. Let me walk you through a sample of it in this article. If you like to learn more about Power BI, read Power BI from Rookie to Rock Star book.
Prerequisite
I highly recommend reading these two articles before reading this article:
- Row Level Security in Power BI
- Dynamic Row Level Security
- Row Level Security with Analysis Services Live Connection
and I also highly recommend below articles, if you are interested to learn more about patterns of dynamic row-level security in Power BI:
- Dynamic Row Level Security with Manager Level Access
- Dynamic Row Level Security with Users and Profiles
- Dynamic Row Level Security with Organizational Hierarchy
- Dynamic Row Level Security with Many to Many relationships and Organizational Hierarchy – Part 1
- Dynamic Row Level Security with Many to Many relationships and Organizational Hierarchy – Part 2
Introduction
Row-Level Security in Power BI means limiting the access to the data rows in an existing Power BI dataset or report. Let’s say; you share a Power BI report with user 1 and user 2, but you want them to see only part of the data from the whole report, not the entire data. You want user 1 to see for example sales of USA, and user 2 to see sales of Canada. This is something you can do with row-level security, and in this article, I explained the basics of it.
For example, you can have a report which looks like below:
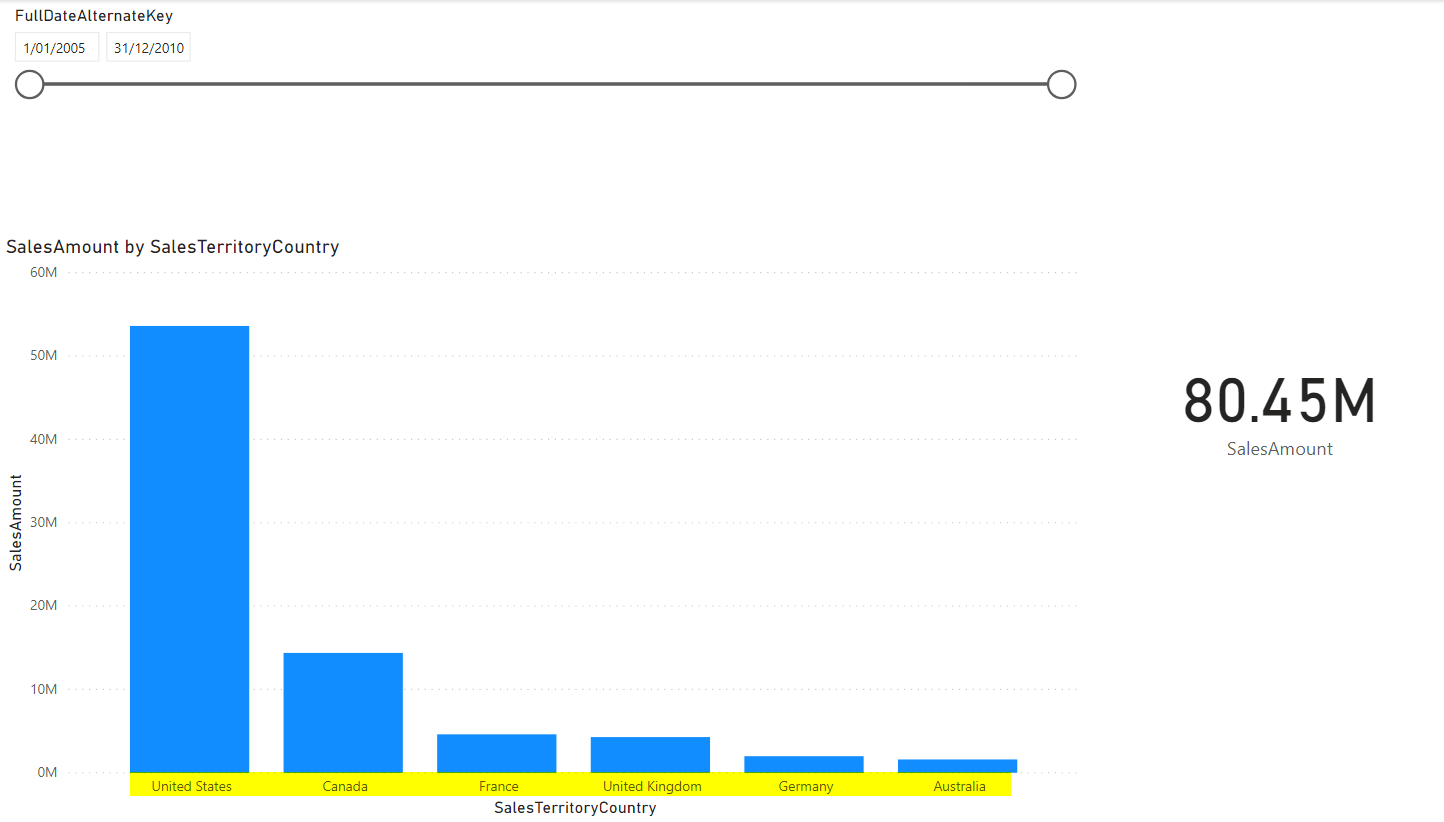
Which has information about all countries, and then you can apply row-level security that limits the access for some users, and they see only part of the data, like this:
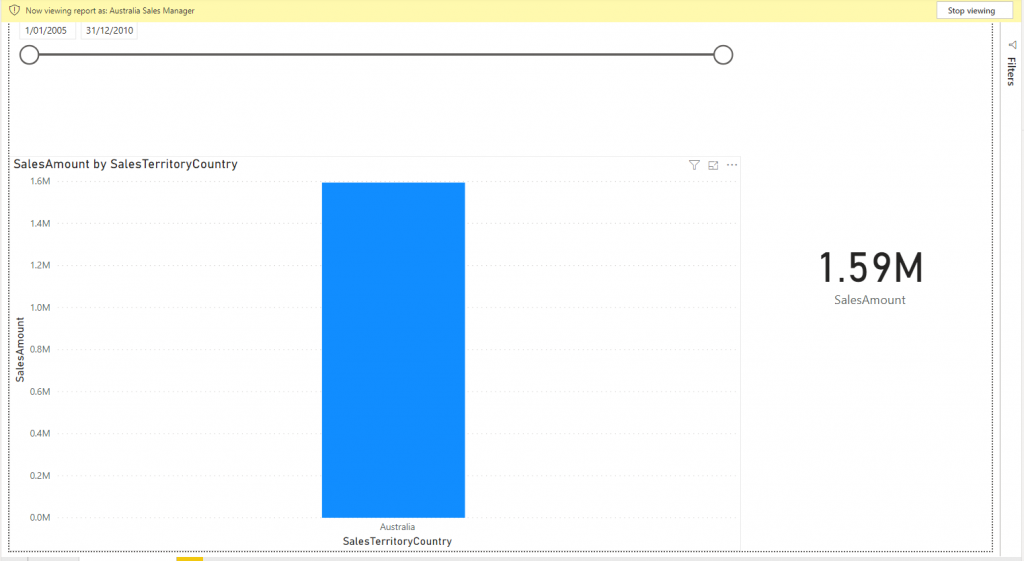
The screenshots that you have seen here are coming from my row-level security article which I explained step by step guide of how to implement it.
The Challenge
One of the challenges in the above implementation is that how you can access the total level data (average, sum) without exposing the details. Let’s say that the sales manager of the United States wants to compare his sales with total sales and see how much percentage of the total sales across all countries belongs to his region. Unfortunately, using DAX functions such as ALL or other functions that changes the scope of filter won’t give you much luck. Because the row-level security is applied on the dataset table level before setting the filter context.
I usually do this with an aggregated table for the total values. Users don’t need to learn about the details of other countries, they just need a total of all countries. so this can be an aggregated table with no country information in it. Let’s see that through an example:
Sample Model
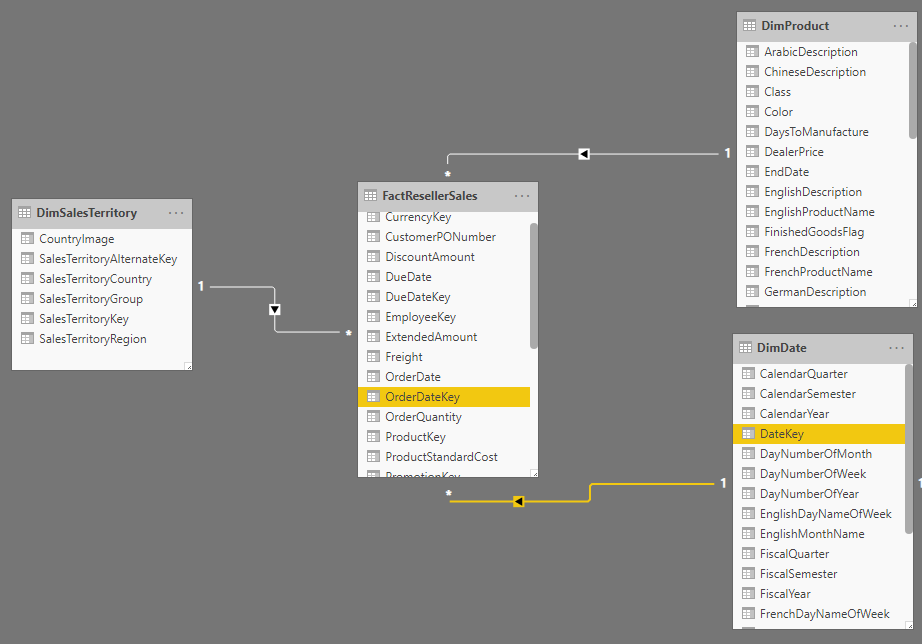
I am using the AdventureWorksDW2012 Excel dataset, which you can download it here. and I am using these tables: DimSalesTerritory, DimDate, DimProduct, and FactResellerSales.
Create the Aggregated Table
You can create this aggregated table anywhere: in the data source using T-SQL or other database languages, or in Power Query using Group By or any other places you are more comfortable doing the aggregation. I use Power Query because that is the method you can use regardless of the data source.
The first step is to create a copy of FactResellerSales table, then Group By in the Power Query Editor;
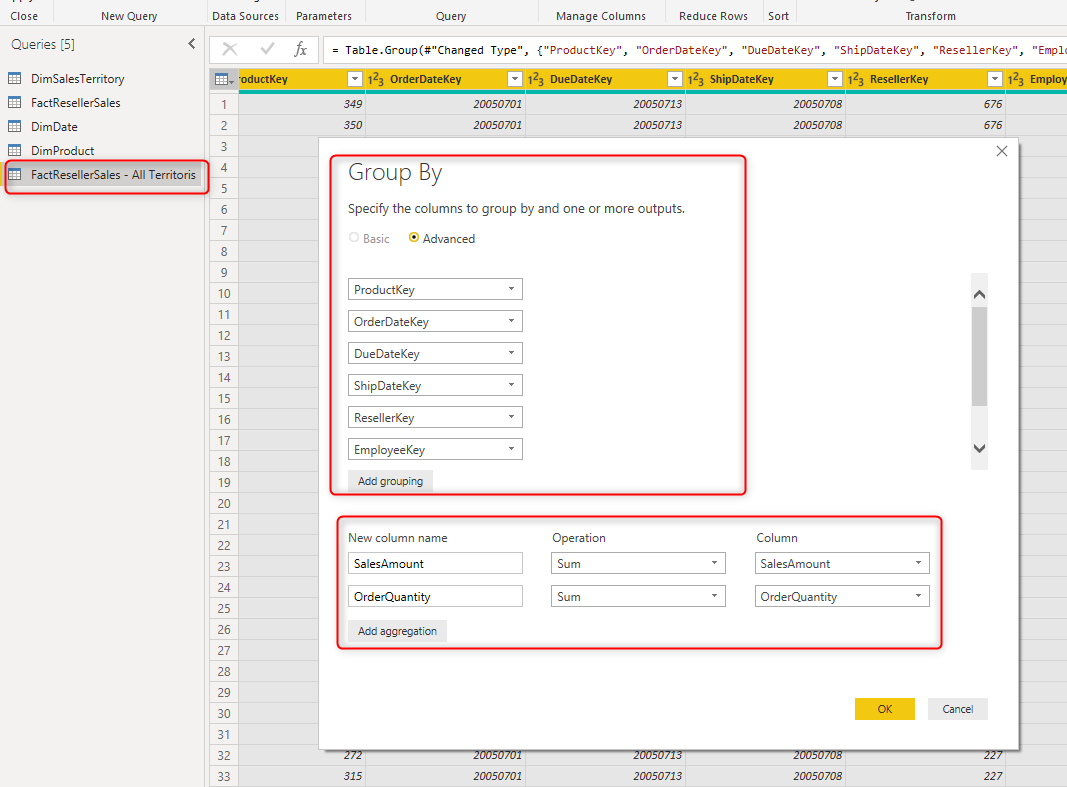
For this Group By operation, I use all key fields in the FactResellerSales except SalesTerritoryKey (because that is the field that connects this table to DimSalesTerritory, which is going to have the row-level security filter enabled on it). You can also add as many aggregations you want as Sum, Min, Max, Average etc.
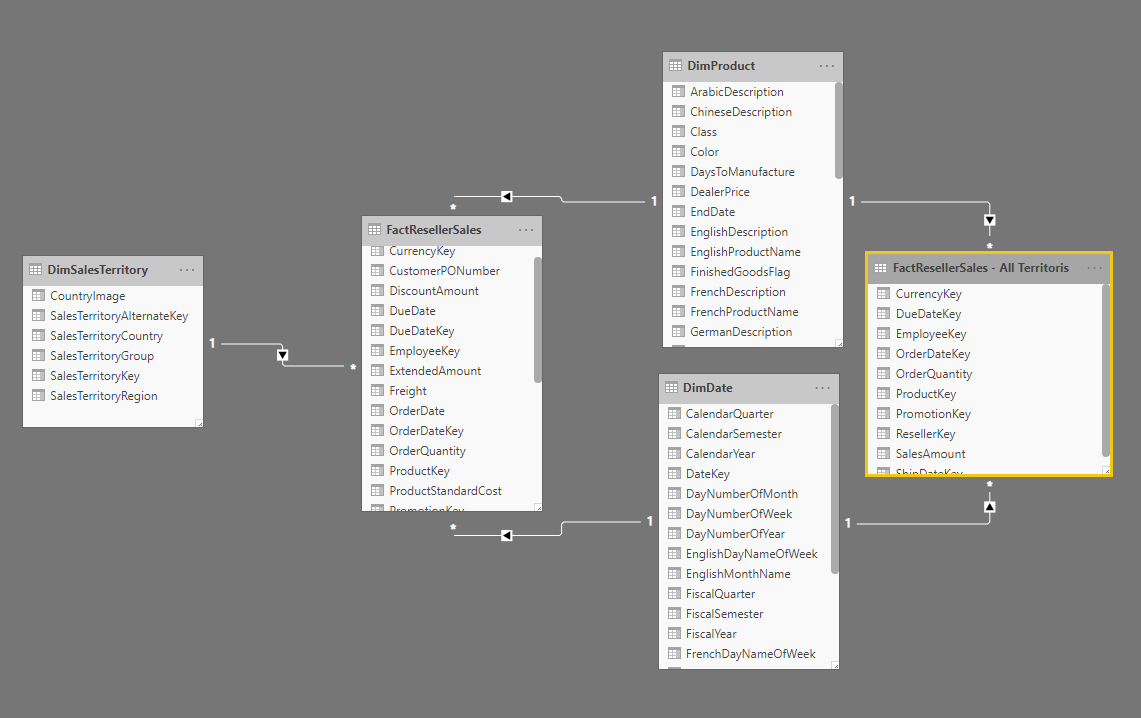
Add the Aggregated table to the model
In a very simple data model, your aggregated table might be only returning one row: the total. However, if in your data model is slicing and dicing by multiple dimension tables, then it is likely that you need to connect your aggregated table to other tables. Our sample here is one of those too. I connect the aggregated table to the DimProduct and DimDate, but not to the DimSalesTerrirory, because now this aggregated table has the totals of all territories.
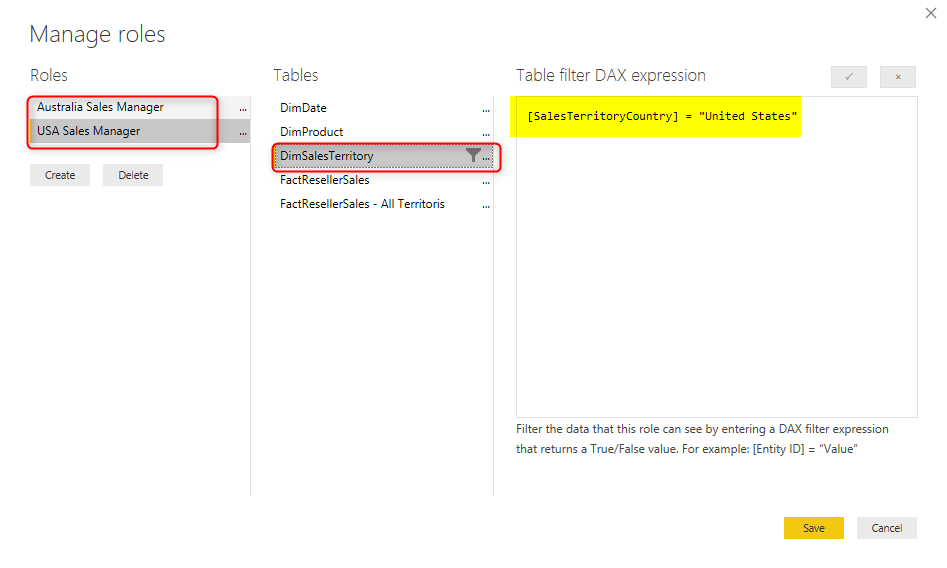
Row-Level Security Definition
In this sample example, I have used static row-level security. However, the same approach with slight changes can be used for dynamic row-level security too. here are my roles:
Testing the Solution
Well, that’s pretty much all of it in terms of the modelling. To test the work, you can create a measure such as below:
My Country Sales vs Total Sales = SUM(FactResellerSales[SalesAmount])/SUM('FactResellerSales - All Territoris'[SalesAmount])
and show it on a page with other visuals:
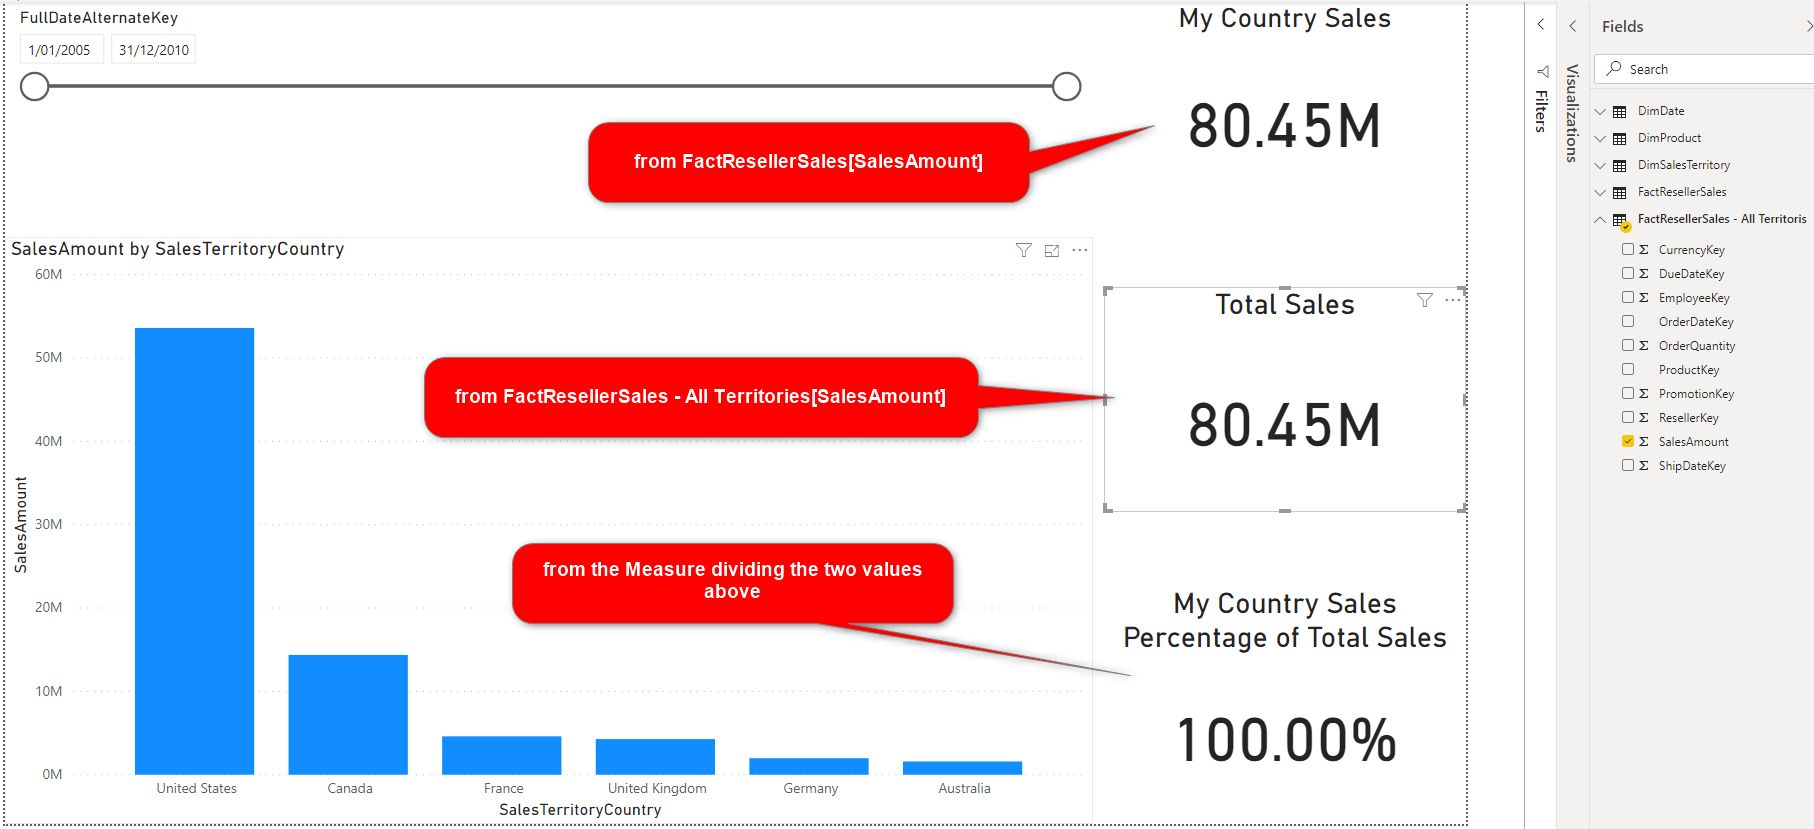
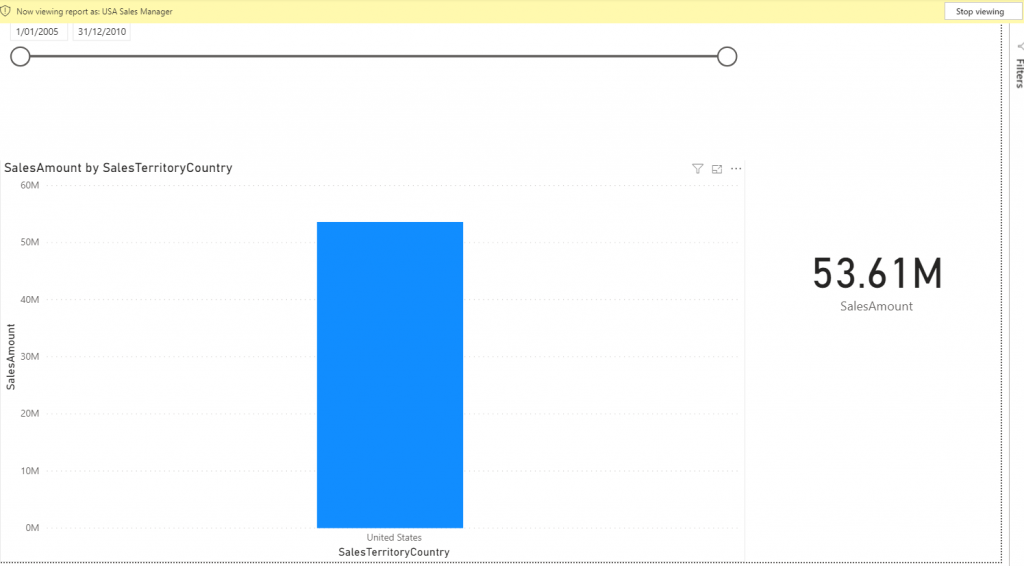
Now, if you try to view this as a user, let’s say United States Sales Manager user, this is what you see:
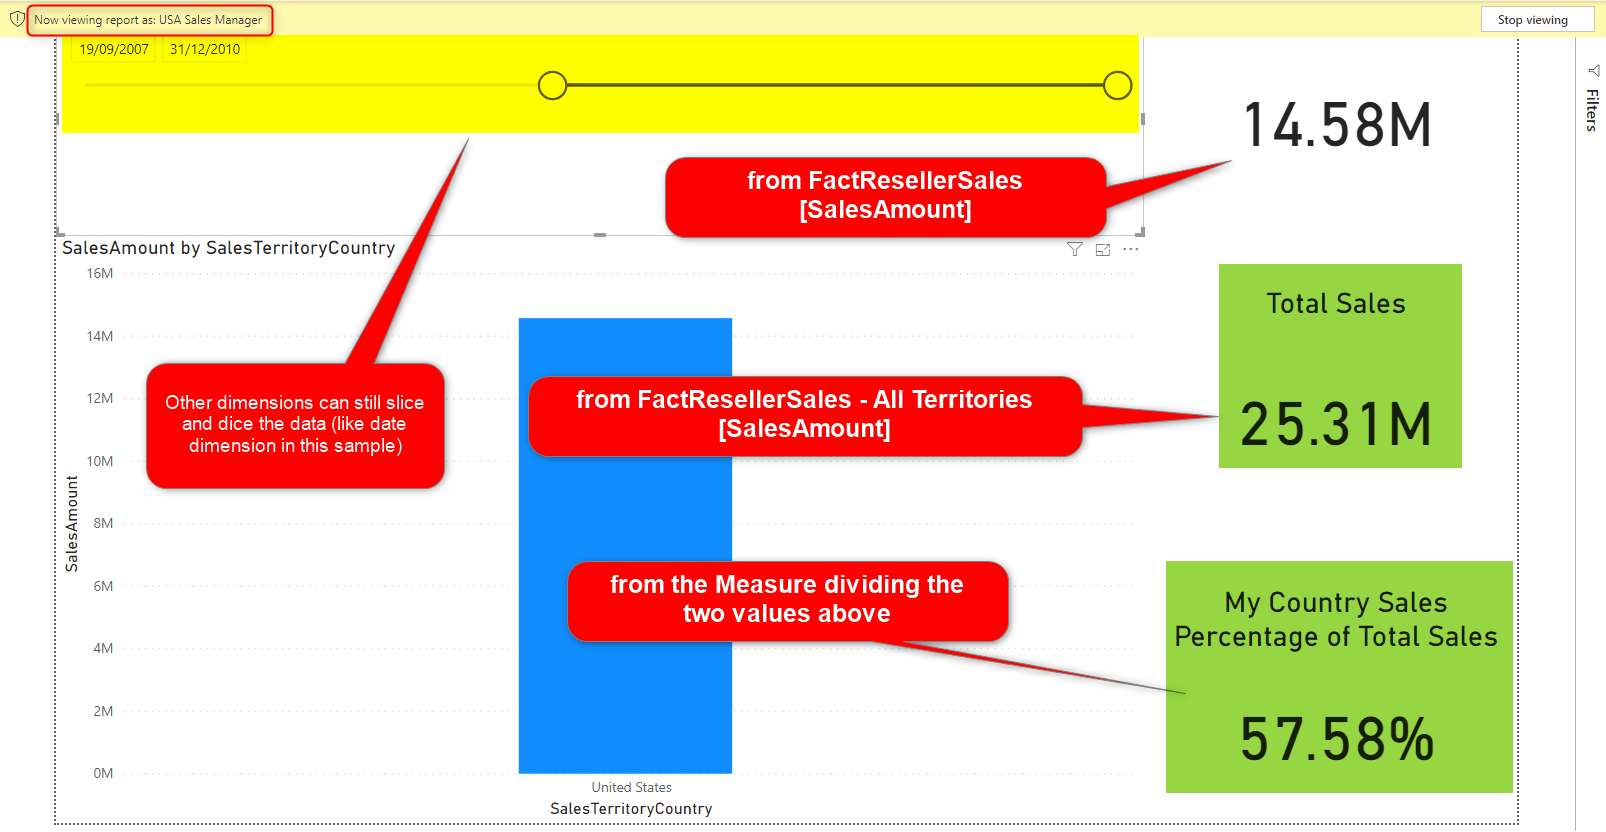
You can see that the detailed table (FactInternetSales) got filtered by the row-level security configuration. However, the total table only gets filtered by other dimensions (such as date table in this case), not the DimSalesTerritory.
How to Implement it with Dynamic Row-Level Security?
If you are implementing this in a dynamic row-level security approach, then the aggregated table should not be connected to your user table (in simple DRLS scenarios). However, for more complex scenarios, you need to think about how to implement it. for example, you might want other users to see the total of higher-level organizational hierarchy or something, which depends on that the aggregated table should be created and connected to the model.
Summary and Study More
In Summary, this article was an explanation of the aggregated table approach used to enhance the row-level security based dataset, so that you can calculate values vs total, or percentages or etc. I have written the most comprehensive set of articles you can find about row-level security in Power BI, which I highly recommend you to read them all;
- Row Level Security in Power BI
- Dynamic Row Level Security
- Row Level Security with Analysis Services Live Connection
- Dynamic Row Level Security with Manager Level Access
- Dynamic Row Level Security with Users and Profiles
- Dynamic Row Level Security with Organizational Hierarchy
- Dynamic Row Level Security with Many to Many relationships and Organizational Hierarchy – Part 1
- Dynamic Row Level Security with Many to Many relationships and Organizational Hierarchy – Part 2
- Calculate totals and Percentages of totals in Row Level Security (this article)


Reza is author of more than 14 books on Microsoft Business Intelligence, most of these books are published under Power BI category. Among these are books such as Power BI DAX Simplified, Pro Power BI Architecture, Power BI from Rookie to Rock Star, Power Query books series, Row-Level Security in Power BI and etc.
He is an International Speaker in Microsoft Ignite, Microsoft Business Applications Summit, Data Insight Summit, PASS Summit, SQL Saturday and SQL user groups. And He is a Microsoft Certified Trainer.
Reza’s passion is to help you find the best data solution, he is Data enthusiast.
His articles on different aspects of technologies, especially on MS BI, can be found on his blog: https://radacad.com/blog.
How we can achieve this if Multiple Fact Tables Exists(around 15 )?
If you want the total level calculation for all of those tables, then you would need aggregated version of all of those. but you can simplify it and if they are all in one grain put them in one table aggregated.