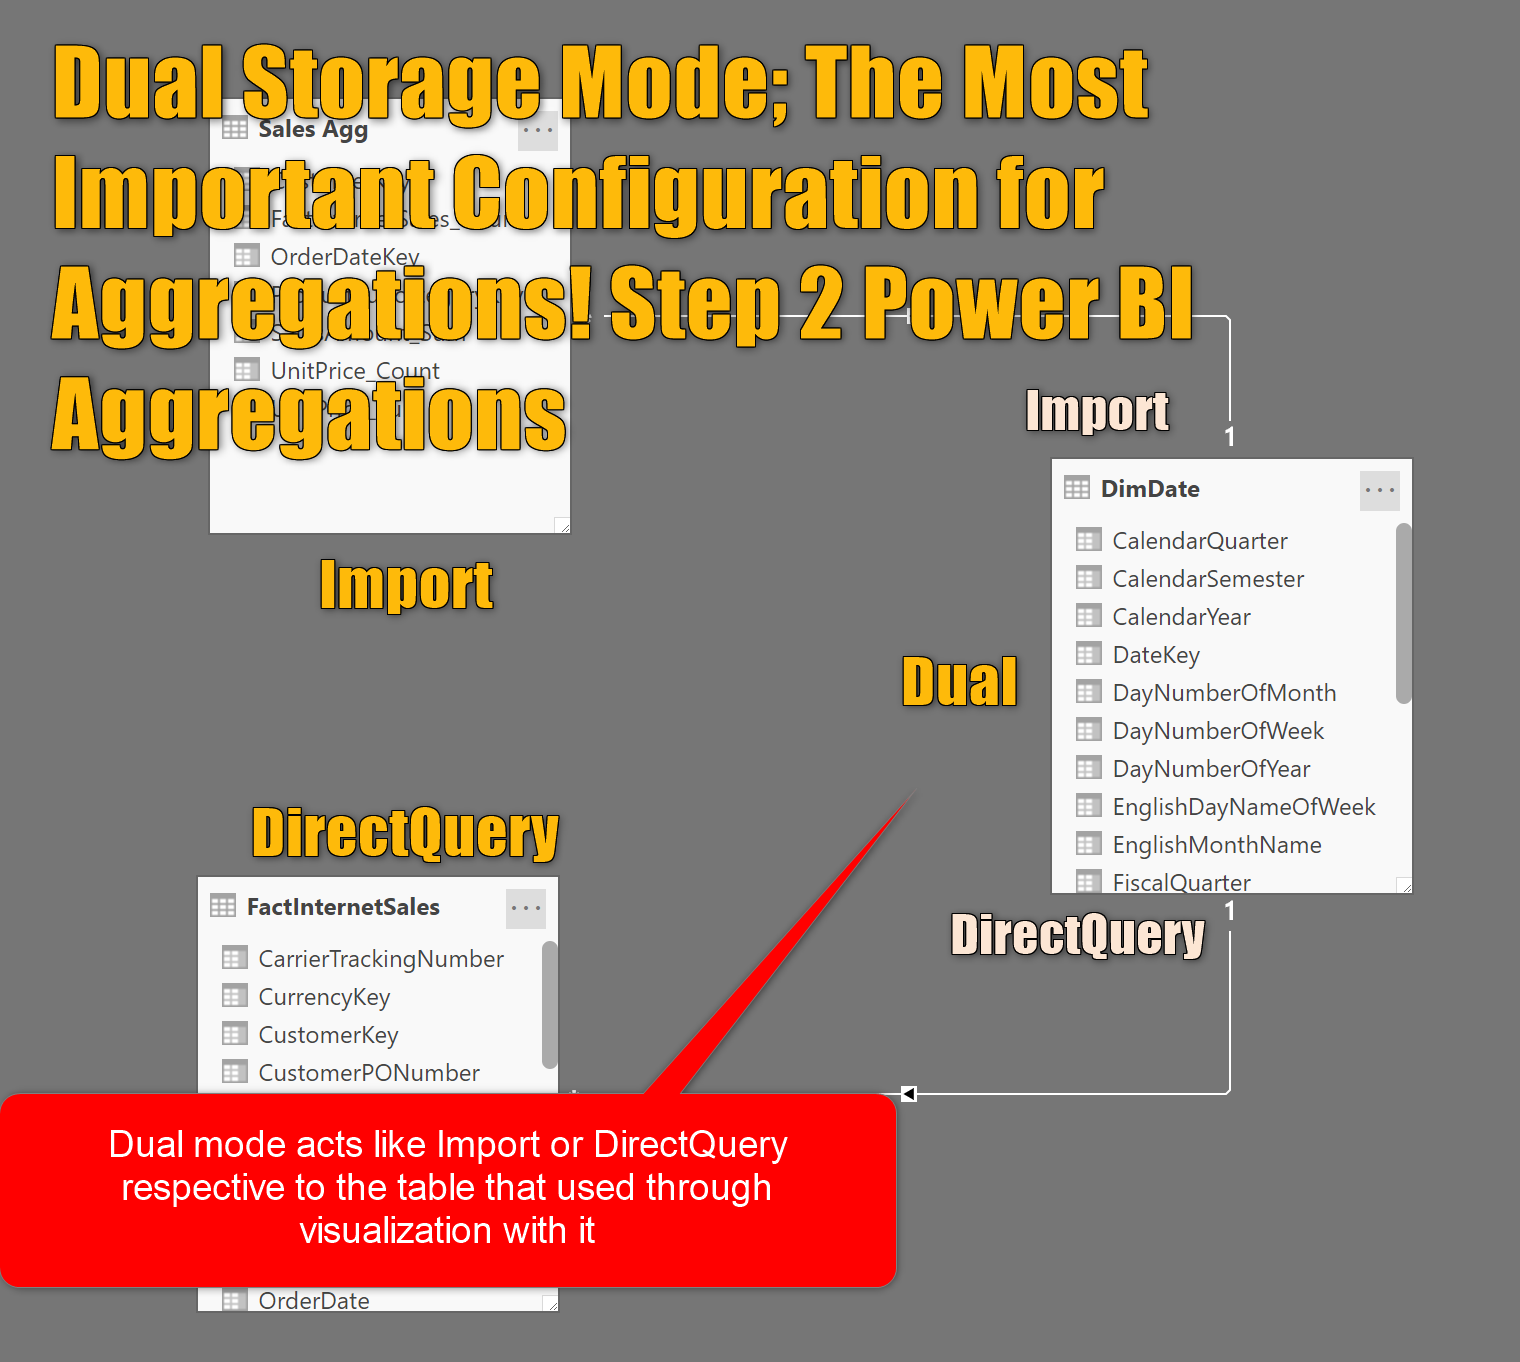
Power BI Aggregation: Step 1 Create the Aggregated Table

Aggregation tables are the fast-performing solution for huge DirectQuery tables in Power BI. In the previous blog post, I explained what aggregation is and why it is an important part of a Power BI implementation. Aggregations are part of the Composite model in Power BI. Your first step for the aggregation set up is creating Read more about Power BI Aggregation: Step 1 Create the Aggregated Table[…]

Quick Measures in Power BI: You don’t have to write DAX!?

You read it right, you don’t have to write DAX. If you are calculating a year to date, running total, or every rolling average, you may be able to do it without writing a single line of DAX code. How this is possible? With Quick Measures. Quick measures are an easy way to create DAX Read more about Quick Measures in Power BI: You don’t have to write DAX!?[…]

UseRelationship or Role-Playing Dimension; Dealing with Inactive Relationships in Power BI

In a Power BI model, relationships are important for passing filters, filter propagates through relationships. However, sometimes you create the relationship between two tables, and the relationship is a dashed line. In this post, I’ll explain to you everything you need to know about a dashed relationship, or as it called Inactive relationship. I will Read more about UseRelationship or Role-Playing Dimension; Dealing with Inactive Relationships in Power BI[…]

Power BI Date Dimension; Default or Custom? Is It Confusing?

If you have worked with Power BI for some time, you know that there are two types of the Date dimensions; Custom or built-in/Default. It is always confusing for people, that which date dimension is good to use, and what is the difference between these two approaches. Also based on the selection of the type Read more about Power BI Date Dimension; Default or Custom? Is It Confusing?[…]