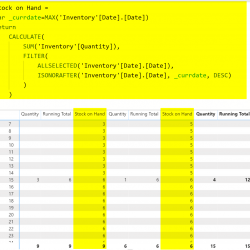
Power Query Parameters Vs. What If Parameters: Power BI Implementation Use Cases

I have written about both types of parameters in Power BI; Power Query parameters and also the What If parameters. However, still many people are not aware that these two are different, and serve different purposes. In this blog article, I am explaining the differences between these two types of parameters, as well as the Read more about Power Query Parameters Vs. What If Parameters: Power BI Implementation Use Cases[…]

Power BI What If Parameter for Getting the Sales of X months ago: Use Case Scenario

There are two types of parameters in Power BI, Power Query parameters, and What if parameters. In this article, I’m going to explain a very useful use case of the what-if parameters, and if you haven’t ever worked with it, it is a great way to understand what is What If parameters and what things Read more about Power BI What If Parameter for Getting the Sales of X months ago: Use Case Scenario[…]

Slicer with AND condition in Power BI

The default behaviour of the slicer in Power BI is that it shows the result of OR when you select multiple items. For example, if you have a slicer for product colour, and then you select both “Black”, and “Blue” the result would be all records that have “Black”, OR “Blue”. Of course, you won’t Read more about Slicer with AND condition in Power BI[…]

Change the Source of Power BI Datasets Dynamically Using Power Query Parameters

Parameters in Power Query are useful for many scenarios when you want to do something dynamic in the data transformation process. I have previously explained how helpful they are in creating a custom function. In this article, I am showing you another useful way of using Parameters to create dynamic datasets, that you can change Read more about Change the Source of Power BI Datasets Dynamically Using Power Query Parameters[…]

Enhance the Card Visual in Power BI with Conditional Formatting

The conditional formatting can be used in many visuals in Power BI, and I have explained an example of doing it in table visual. This feature is also available in the Card Visual in Power BI, However, I have seen a very few people using it. In this short blog article, I’ll explain how this Read more about Enhance the Card Visual in Power BI with Conditional Formatting[…]

Calculating Total, and Percentages in a Row-Level Security Power BI Model

I have written dozens of articles about row-level security so far and explained in all of them explained different methods in which you can reduce the amount of data rows that a user can see based on their roles. However, in my presentations, I still get this question that: What if I want to compare Read more about Calculating Total, and Percentages in a Row-Level Security Power BI Model[…]

Get The Error Count with the Profiling Data of Power BI Data Table using Power Query

I have explained previously how you can use the Table.Profile Power Query function to fetch the profiling data of a table, such as minimum value, maximum value, null count etc, and use it in a report page to inform the user about the quality of the data. However, that function doesn’t provide you with one Read more about Get The Error Count with the Profiling Data of Power BI Data Table using Power Query[…]

Find The Data Value using LookupValue DAX Function in Power BI; Simple and Useful

LookupValue function is neither a new function in DAX nor a complex one. However, I figured out in my training courses and presentations, that there are still a few people aware of this function. This is a very simple, yet powerful function in DAX which is particularly helpful whenever you are looking to find a Read more about Find The Data Value using LookupValue DAX Function in Power BI; Simple and Useful[…]

Key Influences Visual: Expand By Fields

  In the previous article, I have explained what is the key influencers visual and how it works. Later the count and impact have been explained in the other Post. Initially, Key Influencers visual just has two data fields: Analyze and Explained by the Analyze fields, analyse the data based on row by row, so Read more about Key Influences Visual: Expand By Fields[…]

Creating a List of Numbers or Dates in Power BI using GenerateSeries Function in DAX

If you ever need to create a list of numbers (either decimal or whole number), or list of dates and times, there is a very simple and useful function in DAX which helps. GenerateSeries is a simple function to use to create a list. In this article, I’ll explain how you can use this function. Read more about Creating a List of Numbers or Dates in Power BI using GenerateSeries Function in DAX[…]