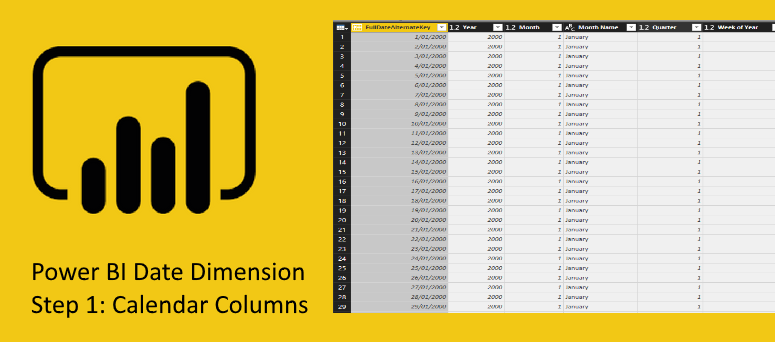
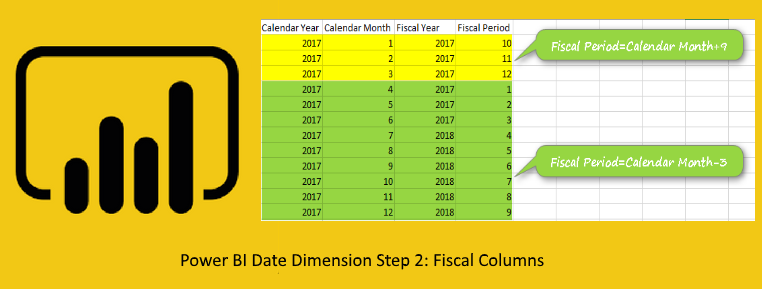
Basics of M: Power Query Formula Language

M is the powerful language behind the scene of Power Query. Any transformation you apply will be written in M language. For many, M looks like a scary language. In this post I like to explain a bit of basics of M. Not mentioning any functions. Mainly I want to explain to you how the Read more about Basics of M: Power Query Formula Language[…]

Interactive Charts using R and Power BI: Create Custom Visual Part 3

In the last two posts (Part 1 and 2), I have explained the main process of creating the R custom Visual Packages in Power BI. there are some parts that still need improvement which I will do in next posts. In this post, I am going to show different R charts that can be used Read more about Interactive Charts using R and Power BI: Create Custom Visual Part 3[…]

Integrate Power BI into Your Application: Part 5 – Data Source Management

New REST API of Power BI is revolutionary. In addition to embedding content in Power BI, ability to refresh data set from API, it also gives you many functions to work with Gateways and Data Sources. With this API, you can set up new data sources, clone data sets, check the credentials of a data Read more about Integrate Power BI into Your Application: Part 5 – Data Source Management[…]

Interactive Charts using R and Power BI: Create Custom Visual Part 1

I am so excited about using Plotly packages in Power BI. So What is Plotly: is an R package for creating interactive web-based graphs via the open source JavaScript graphing library: https://plot.ly/r/getting-started/ this feature has been added recently and had been announce by Christian Christian Berg in Data insight summit 2017. I started to search about Read more about Interactive Charts using R and Power BI: Create Custom Visual Part 1[…]

Integrate Power BI into Your Application: Part 4 – Refresh Data Set

Power BI REST API is not just for embedding content or getting list of dashboards and reports. It also has many functions to work with data sets, gateways, and data sources. As one of the many exciting features of that; you can easily refresh a data set from an application. you can refresh it as Read more about Integrate Power BI into Your Application: Part 4 – Refresh Data Set[…]

Integrate Power BI into Your Application: Part 3 – Embed Content

In the part 1, you learned how to register an application to be able to interact with Power BI service and Azure environment. In the part 2, you learned how the authentication process works and how you can get the access token. In this part, I’m going to explain what is the process of embedding Read more about Integrate Power BI into Your Application: Part 3 – Embed Content[…]

Integrate Power BI into Your Application: Part 2 – Authenticate

In the part 1, you learned how to register an application to be able to interact with Power BI service and Azure environment. In this part, I’m going to explain what is the process involved after that in order to authenticate through your application into Azure Active Directory. This step is important step before doing Read more about Integrate Power BI into Your Application: Part 2 – Authenticate[…]

Integrate Power BI into Your Application: Part 1 – Register your App

Power BI Embedded, which I have written about it previously, brings the power of Power BI into your application. Power BI Embedded Recently had major changes. If you remember from my previous post, there were many limitations in the type of content you can embed into your application and the ways of interacting with it, Read more about Integrate Power BI into Your Application: Part 1 – Register your App[…]

Visualizing Data Distribution in Power BI – Histogram and Norm Curve -Part 2

In the Part 1 I have explained some of the main statistics measure such as Minimum, Maximum, Median, Mean, First Quantile, and Third Quantile. Also, I have show how to draw them in Power BI, using R codes. (we have Boxplot as a custom visual in power BI see :https://powerbi.microsoft.com/en-us/blog/visual-awesomeness-unlocked-box-and-whisker-plots/ ). However, to see the data Read more about Visualizing Data Distribution in Power BI – Histogram and Norm Curve -Part 2[…]